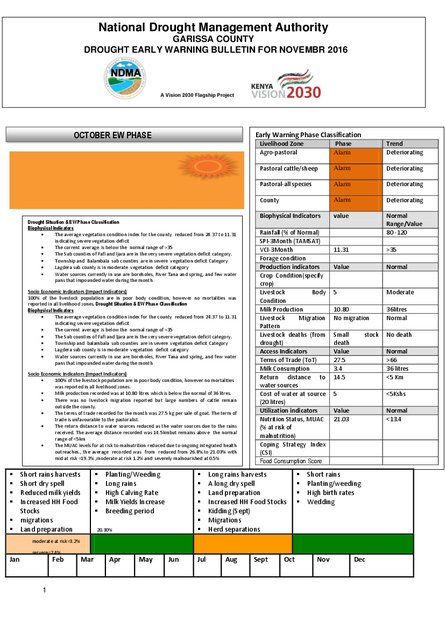
Drought Situation & EW Phase Classification
Biophysical Indicators
The average vegetation condition index for the county reduced from 24.37 to 11.31 indicating severe vegetation deficit
The current average is below the normal range of >35
The Sub counties of Fafi and Ijara are in the very severe vegetation deficit category.
Township and Balambala sub counties are in severe vegetation deficit Category - Lagdera sub county is in moderate vegetation deficit category
Water sources currently in use are boreholes, River Tana and spring, and few water pans that impounded water during the month
Socio Economic Indicators (Impact Indicators)
100% of the livestock population are in poor body condition, however no mortalities was reported in all livelihood zones. Drought Situation & EW Phase Classification Biophysical Indicators
The average vegetation condition index for the county reduced from 24.37 to 11.31 indicating severe vegetation deficit
The current average is below the normal range of >35
The Sub counties of Fafi and Ijara are in the very severe vegetation deficit category.
Township and balambala sub counties are in severe vegetation deficit Category
Lagdera sub county is in moderate vegetation deficit category
Water sources currently in use are boreholes, River Tana and spring, and few water pans that impounded water during the month Socio Economic Indicators (Impact Indicators)
100% of the livestock population are in poor body condition, however no mortalities was reported in all livelihood zones.
Milk production recorded was at 10.80 litres which is below the normal of 36 litres.
There was no livestock migration reported but large numbers of cattle remain outside the county.
The terms of trade recorded for the month was 27.5 kg per sale of goat. The term of trade is unfavourable to the pastoralist.
The return distance to water sources reduced as the water sources due to the rains received. The average distance recorded was 14.5kmbut remains above the normal range of <5km
The MUAC levels for at risk to malnutrition reduced due to ongoing integrated health outreaches., the average recorded was from reduced from 26.8%.to 21.03% with mid at risk =19.3% ,moderate at risk 1.2% and severely malnourished at 0.5%