Methodology and definitions
What is humanitarian assistance?
Humanitarian assistance is intended to save lives, alleviate suffering and maintain human dignity during and after human-made crises and disasters associated with natural hazards, as well as to prevent and strengthen preparedness for when such situations occur. Humanitarian assistance should be governed by the key humanitarian principles of humanity, impartiality, neutrality and independence. These are the fundamental principles of the International Red Cross and Red Crescent Movement, which are reaffirmed in UN General Assembly resolutions and enshrined in numerous humanitarian standards and guidelines.
In this report, when used in the context of financing data, international humanitarian assistance refers to the financial resources for humanitarian action spent outside the donor country. Our calculations of international humanitarian assistance are based on what donors and organisations report as such and do not include other types of financing to address the causes and impacts of crises, which we refer to as crisis-related financing.
There is no universal obligation or system for reporting expenditure on international, or indeed domestic, humanitarian assistance. The main reporting platforms for international humanitarian assistance are the Organisation for Economic Co-operation and Development (OECD) Development Assistance Committee (DAC) and the Financial Tracking Service (FTS) of the UN Office for the Coordination of Humanitarian Affairs (OCHA). OECD DAC members are obligated to report their humanitarian assistance to the DAC systems as part of their official development assistance (ODA), in accordance with definitions set out by the DAC.[1] Some other governments and most major multilateral organisations, including several of the largest private philanthropic foundations, also voluntarily report to the DAC.
The FTS is open to all humanitarian donors and implementing agencies to voluntarily report contributions of internationally provided humanitarian assistance according to a set of inclusion criteria determined by the Inter-Agency Standing Committee.[2]
The analysis of international humanitarian assistance in this report draws largely on data reported to the FTS and the OECD DAC. Between these two sources, there is variation in inclusion criteria for humanitarian assistance, as well as volumes reported, so we aim to consistently explain and cite the data sources used. In this report, we have compared the preliminary DAC and FTS data on humanitarian funding by donor in 2024 to capture the most comprehensive data possible, as explained in more detail below. We include humanitarian funding reported to the FTS that has been provided by OECD DAC members to countries not eligible for ODA. We also use other sources to calculate international humanitarian assistance, including reports from UN agencies and non-governmental organisations (NGOs) on private humanitarian funding and data from the Central Emergency Response Fund on contributions from public donors; data sources and methodologies for these are also clearly marked and explained.
Anticipatory action
Humanitarian financing to anticipatory action initiatives is not systematically collected in the usual data sources, such as OECD DAC or FTS. Our estimates of funding for anticipatory action are based on data collected by the Anticipation Hub, which compiles two datasets. One dataset details how much funding is available to active anticipatory action frameworks, while the other dataset details how much is disbursed when the framework is activated. We adapted the Anticipation Hub’s dataset on active frameworks by adding frameworks that, according to their separate dataset on activations, were active for the same country, year, hazard and coordinating agency.
Infographic – key humanitarian trends
The infographic on key humanitarian trends is based on various sources of data:
- Forced displacement: Source: United Nations High Commissioner for Refugees (UNHCR) mid-year trends. 2024 data is ‘mid-year’ and therefore not considered to be final. Refugees (under both UNHCR and United Nations Relief and Works Agency for Palestine Refugees in the Near East UNRWA), and asylum-seekers have been grouped together into one category.
- Food security: Source: Global Report on Food Crises dataset produced by the Food Security Information Network. The dataset sources data from: Integrated Food Security Phase Classification, Cadre Harmonisé, Famine Early Warning Systems Network and Humanitarian Needs Overviews. Data in this report reflects the most recent version of the dataset available at the time of writing: The Global Report on Food Crises (GRFC) 2024 Mid-Year Update.
- Conflict: Source: Armed Conflict Location & Event Data Project (ACLED); www.acleddata.com. Data displayed starts in 2018 as this is the most recent year with broadly comparable data across years. Data was extracted on 22 April 2025.
- Aid worker security: Source: Humanitarian Outcomes, Aid Worker Security Database, aidworkersecurity.org. Data was extracted on 22 April 2025
- UN appeal requirements: Source: OCHA FTS, UNHCR’s Refugee Funding Tracker (RFT), and Syria 3RP Dashboard.
- UN appeals – people in need and targets: Source: OCHA Global Humanitarian Overview 2025.
- Crisis severity: Source: ACAPS Inform Severity Index. Data based on the January release of each year. Only data points with a medium or higher reliability are included.
Infographic – top donors
The infographic on top donors is based on various sources of data:
- Figures for total funding from donors are for 2024, expressed in 2023 constant prices to align with other analyses in the report. These figures exclude imputed EU contributions to humanitarian assistance.
- Likewise, the percentage of all public donors pertains to donor totals excluding EU imputations.
- Spend as a percentage of GNI uses 2024 total funding data and 2024 GNI data taken from the OECD DAC latest preliminary data as released in April 2025.
- Spend as a percentage of ODA uses the same OECD DAC preliminary data release and as such differs from that in Chapter 4, which uses 2023 data to examine the split across the humanitarian–development–peace nexus.
- Both spend as a percentage of GNI and spend as a percentage of ODA figures for Saudi Arabia use 2023 data due to a lack of 2024 data.
- Data for top sectors and top contexts are taken from the FTS with data extracted in April 2025. Multiple sectors and multi-sector have been combined into one category. Multi-sector often refers to multisectoral assistance provided by UNHCR for refugee settings.
- Sources for policy developments can be found in the ‘Data sources’ section.
Infographic – US humanitarian funding
The infographic on United States (US) funding is based on various sources of data:
- Overall US funding data is based on a total international humanitarian assistance analysis that incorporates bilateral and imputed multilateral contributions to humanitarian assistance. Data is in constant 2023 prices.
- Recipient country exposure to US funding is based on data from UN OCHA’s FTS. This analysis excludes countries with only a requirement under a regional refugee response plan of less than US $100 million in 2024. It excludes countries with funding of less than US $10m in 2024.
- Exposure of specific UN agencies to US funding is based on UN OCHA’s FTS, UNHCR, United Nations Children’s Fund (UNICEF), World Food Programme (WFP), International Organization for Migration (IOM) data, and the GHA dataset on private humanitarian funding. Funding for UNICEF only reflects core funding (‘regular resources’) and humanitarian funding ‘other emergency resources’. All funding is included for WFP and UNHCR. Only funding captured on IOM’s crisis response dashboard is included. Funding to UNRWA, World Health Organization (WHO), United Nations Population Fund (UNFPA), Food and Agriculture Organization of the United Nations (FAO) and OCHA is based on FTS data.
- Exposure of humanitarian sectors to US funding is based on UN OCHA’s FTS. MPC: multi-purpose cash. Funding both in- and outside of response plans is included. Emergency telecommunications are included under logistics. Camp coordination/management is included under coordination and support services. Funding to multiple clusters, multi-sector or other field clusters is excluded.
- US funding to local actors constitutes direct funding to local and national actors and is based on USAID’s localisation self-report dataset, including only humanitarian funding and excluding obligations for procurement. Data is in current prices.
Cash and voucher assistance
Our global estimate of humanitarian assistance provided in the form of cash and vouchers in 2024 is based on data collected from 39 organisations by the CALP Network and supplemented with FTS and HPC Project Module data. For 2024, 89% of the total global value of humanitarian cash and voucher assistance (CVA) is based on survey data, while the other 11% is FTS and HPC Project Module data that supplements the survey data for organisations that did not provide data to CALP in 2024. The methodology used is based on methods devised for previous reports.[3] This methodology utilises machine learning to identify CVA-related funding in funding flows or project descriptions in FTS or the HPC Project Module.
Channels of delivery
We use ‘channels of delivery’ to describe the first and subsequent levels of organisations receiving funding for the delivery of humanitarian assistance – multilateral agencies, non-governmental organisations (NGOs; both international and local/national), the public sector and the international Red Cross and Red Crescent Movement – whether they deliver the assistance themselves or pass it on to partner organisations. Our data on channels of delivery in Figure 2.2 (Chapter 2) comes from the FTS.
Country and region naming conventions
Country and region naming conventions used throughout this report are based on those used by the OECD DAC or the UN. Region naming conventions are based on those used by the OECD. The conventions used do not reflect a political position of ALNAP.
Debt
Data on debt for protracted crisis contexts with a humanitarian response plan (HRP) in 2024 is based on Debt Justice data taken from the Debt data portal. The data represents government external debt payments as a proportion of revenue, which is the amount a government spends on debt payments that leave the country (principal and interest) as a percentage of that government’s revenue. 17 HRP contexts are included, whilst Afghanistan, Ukraine and Venezuela are excluded due to a lack of complete data from 2015 to 2024.
Data for specific countries is based on the World Bank’s International Debt Report (IDR) and examining debt servicing costs of the public and publicly guaranteed sector (principal and interest). Comparisons to HRP value are based on 2023 funding requirements as presented on OCHA’s FTS.
Deflators
Where appropriate in performing analyses of financial trends, we adjust for inflation by applying deflators in constant 2023 prices by source location of the funding. We use US $ gross domestic product deflators from the OECD DAC for DAC members and EU institutions and calculate deflators from the International Monetary Fund World Economic Outlook April 2024 data for other countries. In the limited cases where data was missing from both of these sources, and for financial flows that have a multilateral source, we deflate using the ODA-weighted average DAC deflator from the OECD.
Directional arrows
Across some figures, directional arrows are used to highlight increases, decreases, no significant change, and a lack of information. In Figure 1.3, an increase or decrease is defined as positive or negative 5%, whereas anything in between is defined as no significant change. In Figure 3.1, an increase or decrease is defined as any positive or negative increase in 2025 budgets, whilst no significant change is defined as no change at all. This approach was taken for Figure 3.1 in order to show the direction of travel of donors regardless of magnitude due to the importance of communicating any future budget increases or decreases. Figure 1.3 however shows the exact magnitude of change in percentage terms over 2023 and 2024, and thus a different approach was taken.
Funding for local and national actors
Our analysis of funding to local and national actors in Figures 2.1 and 2.2 (Chapter 2) is based on FTS data alongside data from the UN OCHA country-based pooled funds (CBPFs) Data Hub, the Central Emergency Response Fund (CERF) Data Hub, and UNHCR partner budget information. Figure 2.1 and the associated analysis focuses on funding from all donors, whereas Figure 2.2 and the associated analysis focuses on funding from just Grand Bargain donors.
Classification of organisation type (e.g. national NGOs, UN agencies, etc) is taken from the FTS. This differs from Global Humanitarian Assistance reports, for which Development Initiatives manually coded FTS data by organisation type. This change is due to improvements in organisation type data in the FTS that mean that our own manual coding is no longer needed. Data from the CBPF Data Hub uses the funds’ own classifications of recipients.
This change in methodology also means that we now have updated data for previous years in the FTS. Therefore, the numbers shown in Chapter 2 may differ from previous Development Initiatives reports.
Gross national income
Estimates of humanitarian assistance as a percentage of gross national income (GNI) are calculated using donor international humanitarian assistance figures and GNI figures sourced from the OECD DAC preliminary data for 2024.
Humanitarian–development–peace nexus, and climate financing
Analysis of what constitutes humanitarian, development and peace funding follows the same classification used by Development Initiatives and the Swedish International Development Cooperation Agency in the report Leaving no crisis behind with assistance for the triple nexus: Humanitarian, development and peace funding in crisis contexts. Humanitarian assistance is identified using the following purpose codes: 72010, 72040, 72050, 73010 and 74020. Peace assistance is identified using the following purpose codes: 15210, 15220, 15230, 15240, 15250, 15261, 15113, 15130, 15150, 15151, 15152, 15153, 15160, 15170, 15180, and 15190. All other purpose codes are classified as development assistance.
Funding on climate-related activities uses the Rio markers, and ODA marked as having the principal objective of climate mitigation or climate adaption is included at 100% of its value. Where an activity is marked as having climate mitigation or climate adaptation as a significant objective, the activity is included at 45% of its value. This is the median coefficient reported used by DAC members for activities with a ‘significant’ objective.[4]
In-donor refugee costs
In-donor refugee costs are taken from OECD DAC latest preliminary data as released in April 2025. The comparison with a donor’s international humanitarian spend is based on the donor international humanitarian assistance figure produced for the GHA Report 2025, and not the humanitarian aid category as per the latest preliminary DAC data.
In-donor refugee costs that count as ODA covers costs that donor countries spend on assisting refugees in their own country. The OECD states that the inclusion in this category must be based on international legal definitions and asylum seekers and recognised refugees are covered. Only costs incurred within the first 12 months of arrival should be included in these data, whilst only specific items such as temporary sustenance can be counted as ODA (and not integration costs).
However, there is a large degree of variation between donors in how they report these costs. The OECD DAC has compiled a table of DAC members’ methodologies for reporting these costs, which shows variation across donors.[5] For example, some countries estimate expenditure based on data at the individual level, whereas other countries provide estimates. Some countries count costs related to asylum seekers whose ultimate decision is a rejection of the claim of asylum, whilst other countries do not count these costs.
International humanitarian assistance
Our estimate of total international humanitarian assistance is the sum of that from private donors and from public donors (i.e. government donors and EU institutions) – see Figure 1.1, Chapter 1. Our calculation of international humanitarian assistance from government donors is the sum of:
- ‘Official’ humanitarian assistance (OECD DAC donors)
- International humanitarian assistance from OECD DAC donors to countries not eligible for ODA from the FTS
- International humanitarian assistance from donors outside the OECD DAC using data from the FTS.
- Our ‘official’ humanitarian assistance calculation comprises:
- The bilateral humanitarian expenditure of OECD DAC members, as reported to the OECD DAC database under Table 2A
- The multilateral humanitarian assistance of OECD DAC members.
The multilateral humanitarian assistance of OECD DAC members consists of three elements:
- The unearmarked ODA contributions of DAC members to 10 key multilateral agencies engaged in humanitarian response: the FAO, IOM, the UN Development Programme, UNFPA, UNHCR, UN OCHA, UNICEF, UNRWA, WFP and WHO, as reported to the OECD DAC under Table 2a and the CRS. We do not include all ODA to the FAO, IOM, UN Development Programme, UNFPA, UNICEF, WHO and WFP but apply a percentage to take into account that these agencies also have a ‘development’ mandate. These shares are calculated using data on humanitarian expenditure as a proportion of the total received directly from each multilateral agency.
- The ODA contributions of DAC members to some other multilateral organisations (beyond those already listed) that, although not primarily humanitarian-oriented, do report a level of humanitarian aid to OECD DAC Table 2a. We do not include all reported ODA to these multilateral organisations but just the humanitarian share of this.
- Contributions to the UN Central Emergency Response Fund that are not reported under DAC members’ bilateral humanitarian assistance. We take this data directly from the UN CERF website.
When presenting the international humanitarian assistance of individual OECD DAC countries that contribute to the EU budget, we show in Figure 1.3 (Chapter 1) an imputed calculation of their humanitarian assistance channelled through the EU institutions, based on their ODA contributions to the EU institutions. We do not include this in our total international humanitarian assistance and response calculations or in our ranking of donor contributions to avoid double counting, given the EU institutions are also presented as a donor separately.
Our estimate for official humanitarian assistance in 2024 compares preliminary data by donor between DAC and FTS to reflect the most comprehensive data available. Where humanitarian assistance reported to FTS was greater than official humanitarian assistance based on DAC data as defined above, we used FTS data. Where humanitarian assistance reported to FTS was greater than bilateral humanitarian assistance based on DAC data only, we used FTS data plus imputed multilateral humanitarian assistance based on DAC data. Otherwise, we used an estimate of official humanitarian assistance based on DAC data only. In individual cases, judgment was used to determine which data source to use. For our analysis of funding by donor on FTS we used the flow year for paid contributions and the destination usage year for commitments to try and capture funding in the year it was or expected to be disbursed. FTS data was downloaded on 2 April 2025.
Historic international humanitarian assistance figures were calculated for the first ever GHA report to enable a comparison with recent international humanitarian assistance data. The figure reported in Chapter 1 of US $7.2 billion in 1998 is in constant 2023 prices to enable comparison between years.
People in need of assistance
The number of ‘people in need’ referred to in the report is taken from UN OCHA’s Global Humanitarian Overview series.
Pooled funds
Data on allocations from pooled funds in Chapter 2 is based on data from the CBPF section at OCHA, as well as the CERF Data Hub.
The hypothetical scenarios regarding the new proposals on the use of pooled funds use 2024 HRP appeal funding as the baseline (this also includes funding to contexts that have flash appeals that either have had HRPs in recent years or contexts that have a CBPF, namely Lebanon, Mozambique and Palestine). As allocations in a given year are rarely 100% of the value of contributions in each year, the median ratio of allocations to contributions over the last five years was applied to give a more realistic indication of how much woud be hypothetically allocated under each of the given proposals.
Whilst the Grand Bargain proposal specifies a total proportion of HRP funding going to CBPFs and a portion of that to local and national actors (15% and 70%, respectively), the proposal floated by the Emergency Relief Coordinator specifies a proportion of funding going to CBPFs (a third) but not a portion going to local and national actors. As such, the scenario presented applies the same proportion of direct funding going to local and national actors as per 2024 allocations (35%).
Private funding
We request financial information directly from humanitarian delivery agencies (including NGOs, multilateral agencies and the Red Cross and Red Crescent Movement) on their income to create a standardised dataset on private humanitarian funding received by them. Where direct data collection is not possible, we use publicly available annual reports and audited accounts. The dataset in each year may differ in terms of which organisations are included. For the most recent year, our dataset includes:[6]
- A large sample of NGOs, such as Médecins Sans Frontières and the Norwegian Refugee Council
- Private contributions to FAO, UNHCR, UNICEF, UNRWA and WFP
- The International Federation of Red Cross and Red Crescent Societies and the International Committee of the Red Cross.
Our private funding calculation comprises an estimate of total private humanitarian income for all NGOs, and the private humanitarian income reported by UN agencies, the International Federation of Red Cross and Red Crescent Societies and the International Committee of the Red Cross. To estimate the total private humanitarian income of NGOs globally, we calculate the annual proportion that the NGOs in our dataset represent of NGOs reporting to UN OCHA FTS. The total private humanitarian income reported to us by the NGOs in our dataset is then scaled up accordingly.
Data is collected annually, and new data for previous years may be added retrospectively.
Protracted crisis
Our definition of protracted crisis includes contexts with five or more consecutive years of UN-coordinated appeals, as of the year of analysis. This aligns with the historic definition of protracted crisis as applied by Development Initiatives in prior GHA reports. The types of appeals and response plans used to determine this classification are outlined in ‘UN-coordinated appeals’.
We have chosen this approach to give an indication of the contexts that have consistently, for a number of years, experienced humanitarian needs at a scale that requires an international humanitarian response. Those needs can be limited to specific geographical regions or populations (such as forcibly displaced people).
Countries experiencing protracted crises can be split into two categories. In the first instance, ‘countries’ are the unit of analysis for response plans that target people within a country’s recognised borders. These tend to be humanitarian response plans, flash appeals, and other types of appeals. In the second instance, ‘regional crises’ are the unit of analysis for response plans that are regional in nature and target people in countries affected by the ‘source’ crisis. For example, the Rohingya Joint Response Plan (JRP) and Syria Regional Refugee and Resilience Plan (3RP) are considered as protracted crises as these plans have existed for five or more years. For these regional crises, the countries affected are counted as experiencing protracted crises – in this example, Bangladesh for the Rohingya JRP and Egypt, Iraq, Jordan, Lebanon and Türkiye for the Syria 3RP.
Rounding
There may be minor discrepancies in some of the totals in our charts and infographics, and between those in the text, because of rounding.
Scenarios
In 2025, it is known that the humanitarian sector will contract. What is not known is how big the contraction will be. There are several reasons for this.
Firstly, the picture from the US is fast moving and changing frequently; pieces of information and proposals about the scale of the cuts and future of the US ODA budget have emerged but uncertainty still remains. Secondly, whilst some donors have announced cuts to their total ODA, often these announcements do not have breakdowns regarding the extent of the cuts to the humanitarian portion of their ODA. Thirdly, where budget changes are phased over a period of time, it is not always clear when these changes will take place (e.g. steep cuts in the first year of a parliament, or phase over time).
The challenge of understanding funding flows in 2025 is made more difficult when private donors are taken into account – there is no one source of information or press release to refer to. Therefore, it would be challenging to forecast 2025 humanitarian spending with any degree of certainty.
Three scenarios have been examined: an ‘optimistic scenario’, a ‘moderate scenario’, and a ‘pessimistic scenario’.
These scenarios are based on publicly available information at the time of publication and account for the uncertainty noted above, as well as for the usual fluctuations in humanitarian funding. Private funding is not examined, and countries that are not members of the OECD DAC are assumed to contribute the same as in 2024.
To better understand potential changes in humanitarian donor contributions for 2025, a triangular distribution was used to model uncertainty – with the three values in each distribution given by the assumptions in the table below:
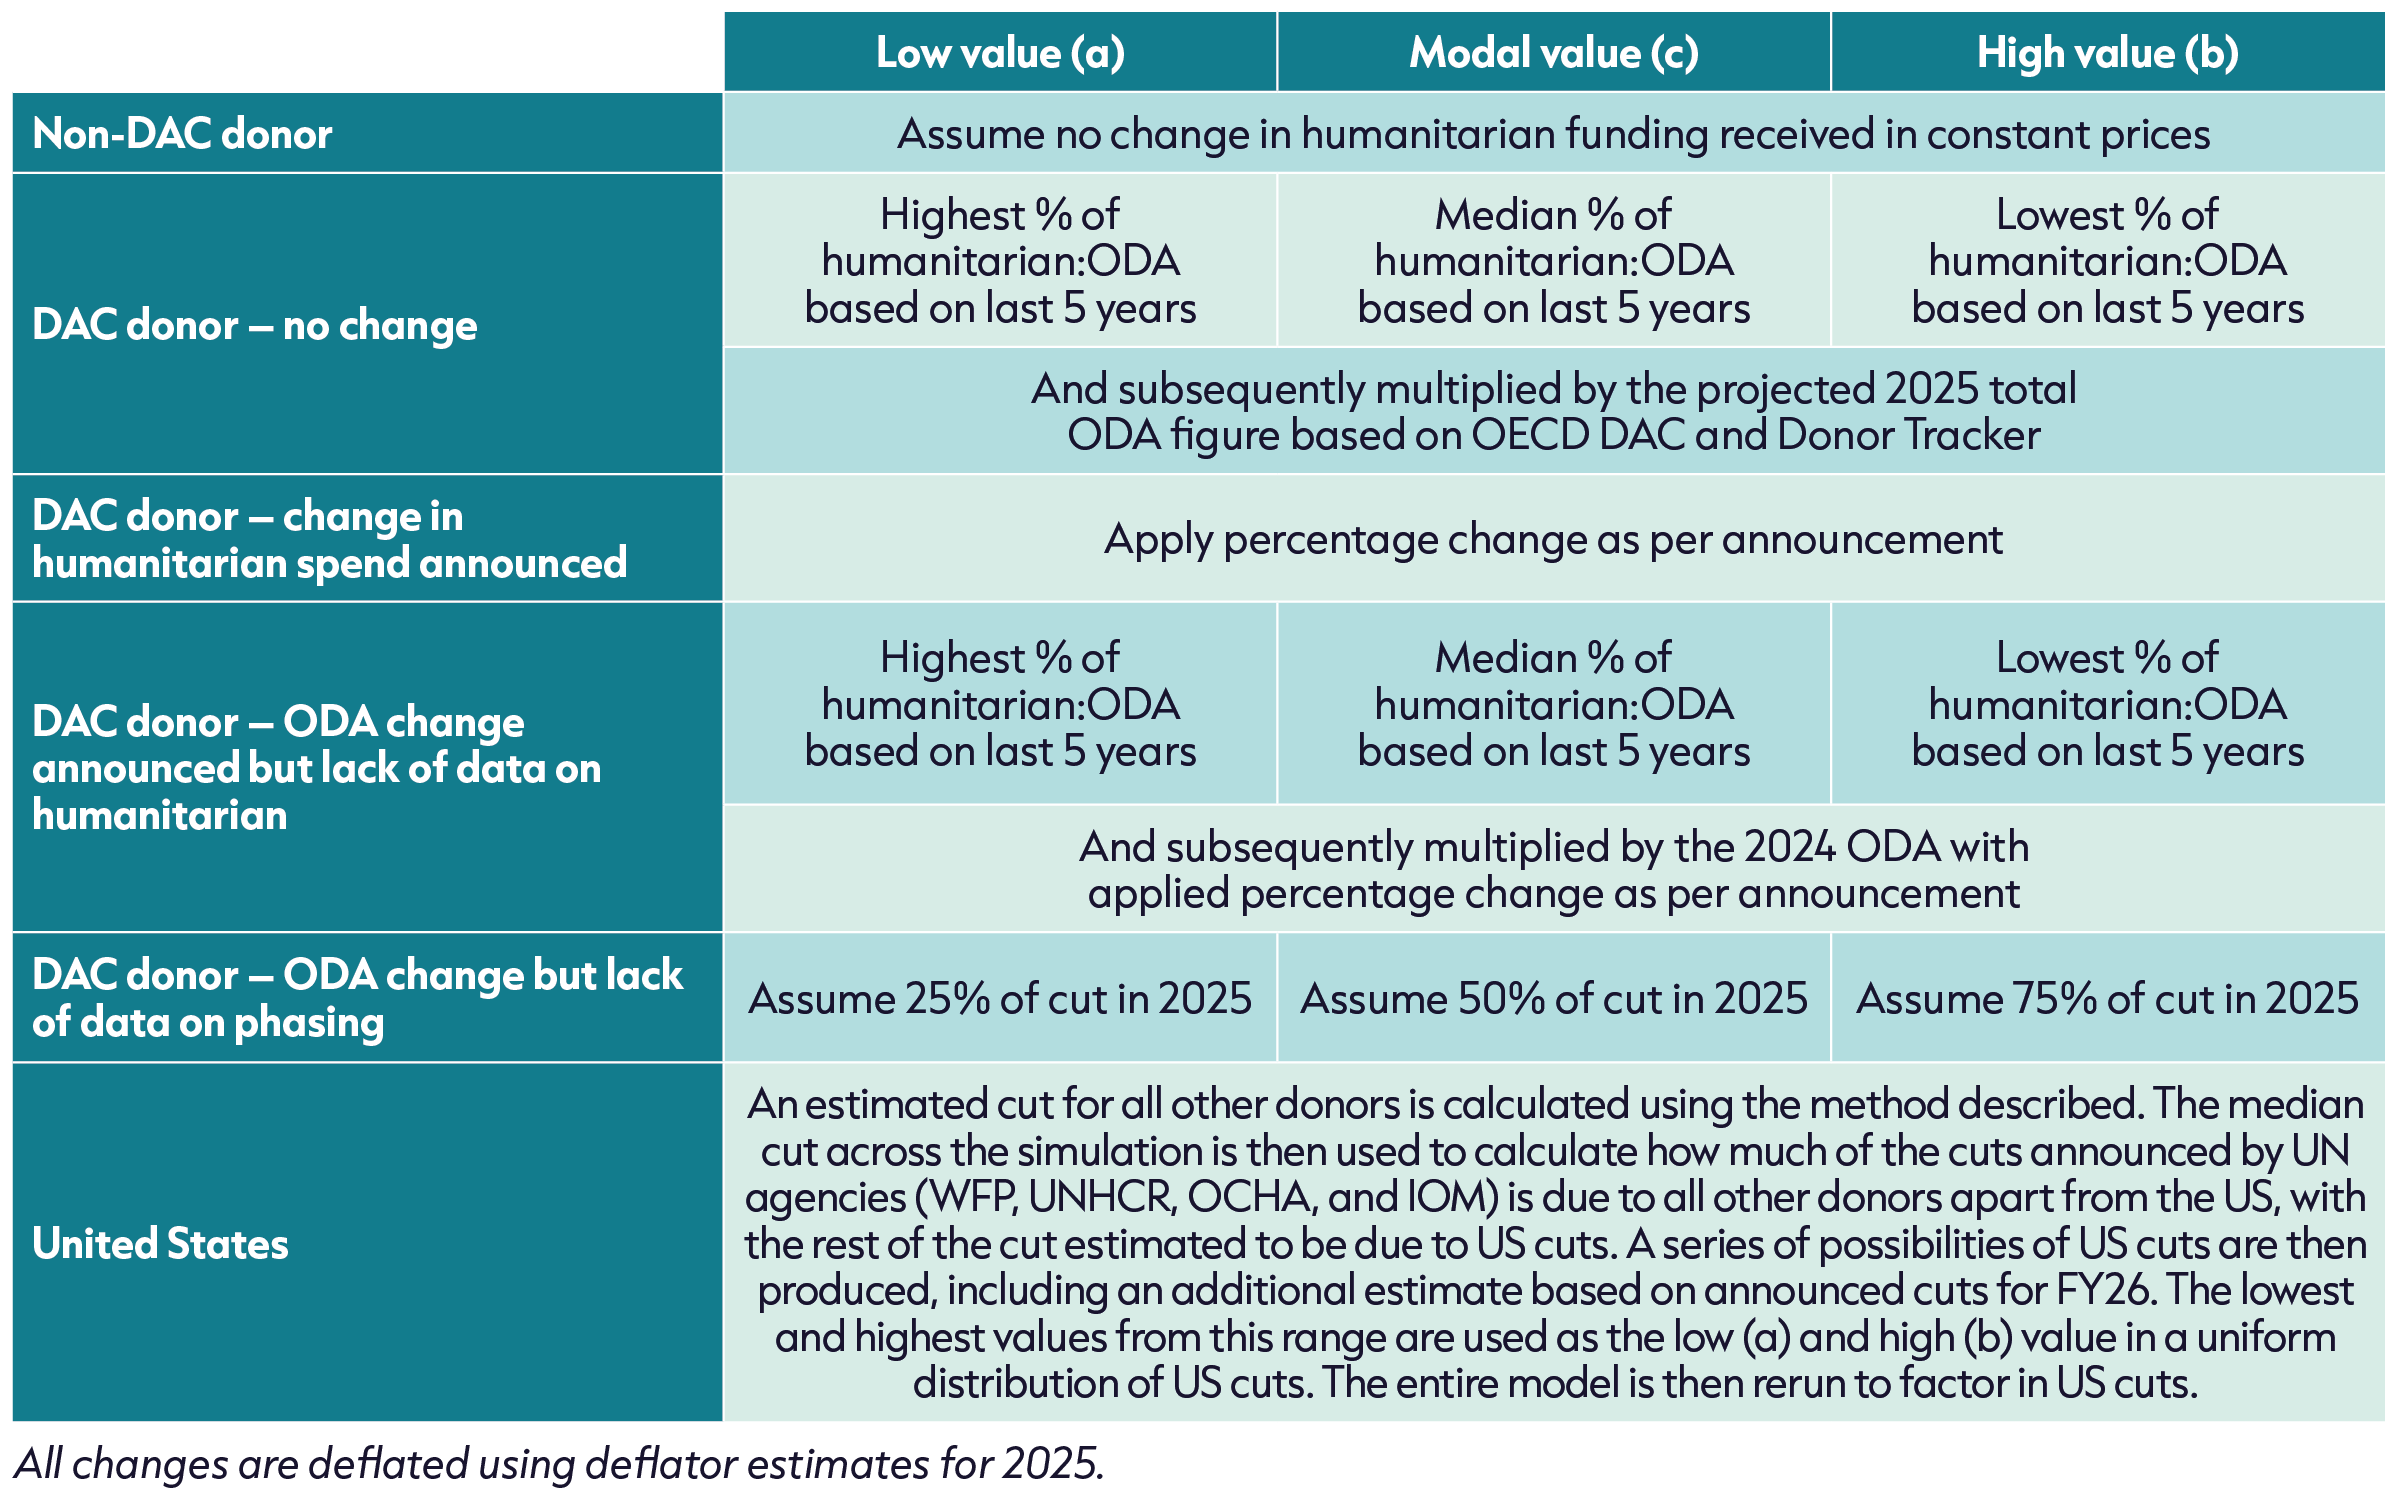
Using these distributions, 10,000 possible outcomes were simulated using a technique known as Monte Carlo simulation, which helps to explore a wide range of plausible futures rather than relying on a single estimate.
From these simulations, we constructed three funding scenarios:
- An ‘optimistic’ scenario: based on the 97.5th percentile of the simulations
- A ‘moderate’ scenario: based on the 50th percentile
- A ‘pessimistic scenario’: based on the 2.5th percentile.
UN-coordinated appeals
We use this term to describe all humanitarian response plans and appeals wholly or jointly coordinated by UN OCHA or UNHCR, including HRPs, flash appeals, joint response plans, regional refugee response plans and other plans. We use data from UN OCHA FTS, UNHCR and the Syria 3RP dashboard for our financial analysis of UN-coordinated appeals in Figures 1.6 (Chapter 1). Data for UN-coordinated plans (funding received and funding requirements) were downloaded in May 2025.
Due to a process of ‘re-prioritisation’ initiated by OCHA in 2025, new ‘prioritised’ funding requirements for the majority of HRPs were released by June 2025. At the time of writing, these prioritised requirements are not centrally available on publicly available platforms such as the FTS – as such, prioritised requirements were mapped using published documents available on Relief Web.
Data sources
ACAPS
INFORM Severity Index
https://data.humdata.org/dataset/inform-global-crisis-severity-index
Anticipation Hub
Anticipatory Action Overview Reports
https://www.anticipation-hub.org/advocate/anticipatory-action-overview-report/
Armed Conflict Location & Event Data (ACLED)
Political violence events by country-year
Debt Justice
Debt data portal
https://data.debtjustice.org.uk/
Donor Tracker | SEEK Development
Individual donor profiles and the ‘Budget Cuts Tracker’
Food Security Information Network
Global Report on Food Crises
https://data.humdata.org/dataset/fsin-grfc
Humanitarian Outcomes
Aid Worker Security Database
https://www.aidworkersecurity.org/
International Monetary Fund (IMF)
World Economic Outlook Database
https://www.imf.org/en/Publications/WEO
International Organization for Migration (IOM)
IOM Crisis Response (Funding)
https://crisisresponse.iom.int/dashboard
Organisation for Economic
Co-operation and Development (OECD)
OECD Creditor Reporting System, Table 1 and Table 2A
OECD Data Explorer (Deflators and Providers’ total use of the multilateral system)
https://data-explorer.oecd.org/
OECD DAC Preliminary 2024 data https://webfs.oecd.org/oda/DataCollection/Resources/ADV2024.xlsx
ReliefWeb
Re-prioritised response plans
Syria Regional Refugee and Resilience Plan (3RP)
3RP Financial Dashboards
https://www.3rpsyriacrisis.org/dashboards/
United Nations Children's Fund (UNICEF)
Transparency tool (Funding)
https://open.unicef.org/transparency-tool
UN High Commissioner for Refugees (UNHCR)
Displacement
https://www.unhcr.org/uk/mid-year-trends
Donors
https://reporting.unhcr.org/donors/
Refugee funding tracker
https://refugee-funding-tracker.org
UNHCR partner data
UN Office for the Coordination of Humanitarian Affairs (OCHA)
Central Emergency Response Fund Data Hub
Financial Tracking Service
Country Based Pooled Funds Data Hub
https://cbpf.data.unocha.org/
Humanitarian Programme Cycle API
https://api.hpc.tools/docs/v2/
Global Humanitarian Overview Reports
https://reliefweb.int/topics/global-humanitarian-overview
UN Relief and Works Agency (UNRWA)
Donor charts
https://www.unrwa.org/how-you-can-help/government-partners/funding-trends/donor-charts
United States Agency for International Development (USAID)
FY20-FY24 Local Funding - Public Report
World Food Programme (WFP)
Funding
https://www.wfp.org/funding/2024
World Bank
International Debt Report
https://www.worldbank.org/en/programs/debt-statistics/idr/products
Footnotes
-
OECD DAC definitions and reporting guidelines can be found at: OECD, Development finance standards. www.oecd.org/dac/financing-sustainable-development/development-finance-standards
-
UN OCHA FTS, 2004 (updated 2017). Criteria for inclusion of reported humanitarian contributions into the Financial Tracking Service database, and for donor / appealing agency reporting to FTS. Available at: https://fts.unocha.org/sites/default/files/2020-10/26.01.17_-_ criteria_for_inclusion_-_2017_updated_annex_i.pdf
-
Development Initiatives, 2022. Tracking cash and voucher assistance. Available at: https://devinit.org/resources/tracking-cash-voucher-assistance/
-
OECD DAC, 2024. Results of the survey on the coefficients applied to Climate Change Rio marker data when reporting to the UNFCCC. September 2024. Available at: https://one.oecd.org/document/DCD/DAC/STAT(2024)28/REV1/en/pdf
-
OECD DAC. DAC members’ methodologies for reporting in-donor refugee costs in ODA. OECD Data Explorer. Available at: https:// data-explorer.oecd.org/vis?fs[0]=Topic%2C1%7CDevelopment%23DEV%23%7COfficial%20Development%20Assistance%20 %28ODA%29%23DEV_ODA%23&pg=0&fc=Topic&bp=true&snb=27&df[ds]=dsDisseminateFinalDMZ&df[id]=DSD_QDD_DCD_ IDRC%40DF_QDD_DCD_IDRC&df[ag]=OECD.DCD.FSD&dq=.&to[TIME]=false&vw=tb
-
We may not have data reported for each organisation in every year. For some NGO alliances, we may have collected data from only one member organisation, therefore treated here as independent.