Reforming amidst crisis
With international humanitarian assistance declining, efforts to build a more efficient, effective and equitable sector are more urgent than ever. Yet in 2024 progress towards reforming how funding is channelled and delivered to people in crisis continued to fall short.
Despite many years of advocacy and policy efforts to promote a more locally led humanitarian system, progress made to increase funding to local and national actors reversed in 2024. The reduction in total humanitarian assistance disproportionately hit local and national actors, with direct funding down by 31% (US $1.2 billion) and total direct and indirect funding down by 22% (US $2.5 billion), accounting for 7.5% of all international humanitarian assistance. At the same time, the bulk of humanitarian funding remained concentrated among international organisations, with 61% of public funding provided to multilateral organisations.
Pooled funds are an increasingly popular tool for channelling funding to the local level. The UN-managed country-based pooled funds (CBPFs) have steadily increased the proportion of allocations to local and national actors, which reached 35% (US $322 million) in 2024. Yet overall donor support for pooled funds has not increased – still making up around 4% of overall international humanitarian assistance. Looking forward, new Grand Bargain and Emergency Relief Coordinator proposals to channel more funding to CBPFs could, if met, have a seismic impact if they include targets for local and national actors. Yet there remains a need to pursue other funding mechanisms and approaches, beyond just the UN-managed pooled funds, if sector-wide localisation commitments are to be achieved.
Efforts to fund more cost effective and efficient interventions have been less successful. After years of growing support for the cash agenda, the volume and proportion of international humanitarian assistance provided as cash and vouchers fell in 2024. At 19.6%, the share of cash and vouchers of total international humanitarian assistance was the lowest since 2021. There is also growing policy support for anticipatory action approaches, however funding available for anticipatory action frameworks stagnated in 2024 (US $305 million) and the volume disbursed fell (US $111 million). Progress has been made on defining, tracking and evidencing anticipatory approaches, but a lack of collective targets may limit accountability for providing the ‘fuel’ money to deliver these approaches at a meaningful scale.
It is not yet clear the extent to which the current funding crisis in 2025 will prove a catalyst for meaningful change, or whether new existential funding threats will mean the little hard-won progress is lost. However, the drop in funding to local and national actors in 2024 in particular suggests they will continue to feel the ongoing impact of budget cuts most acutely.
2.1: What is the trend in funding for local and national actors?
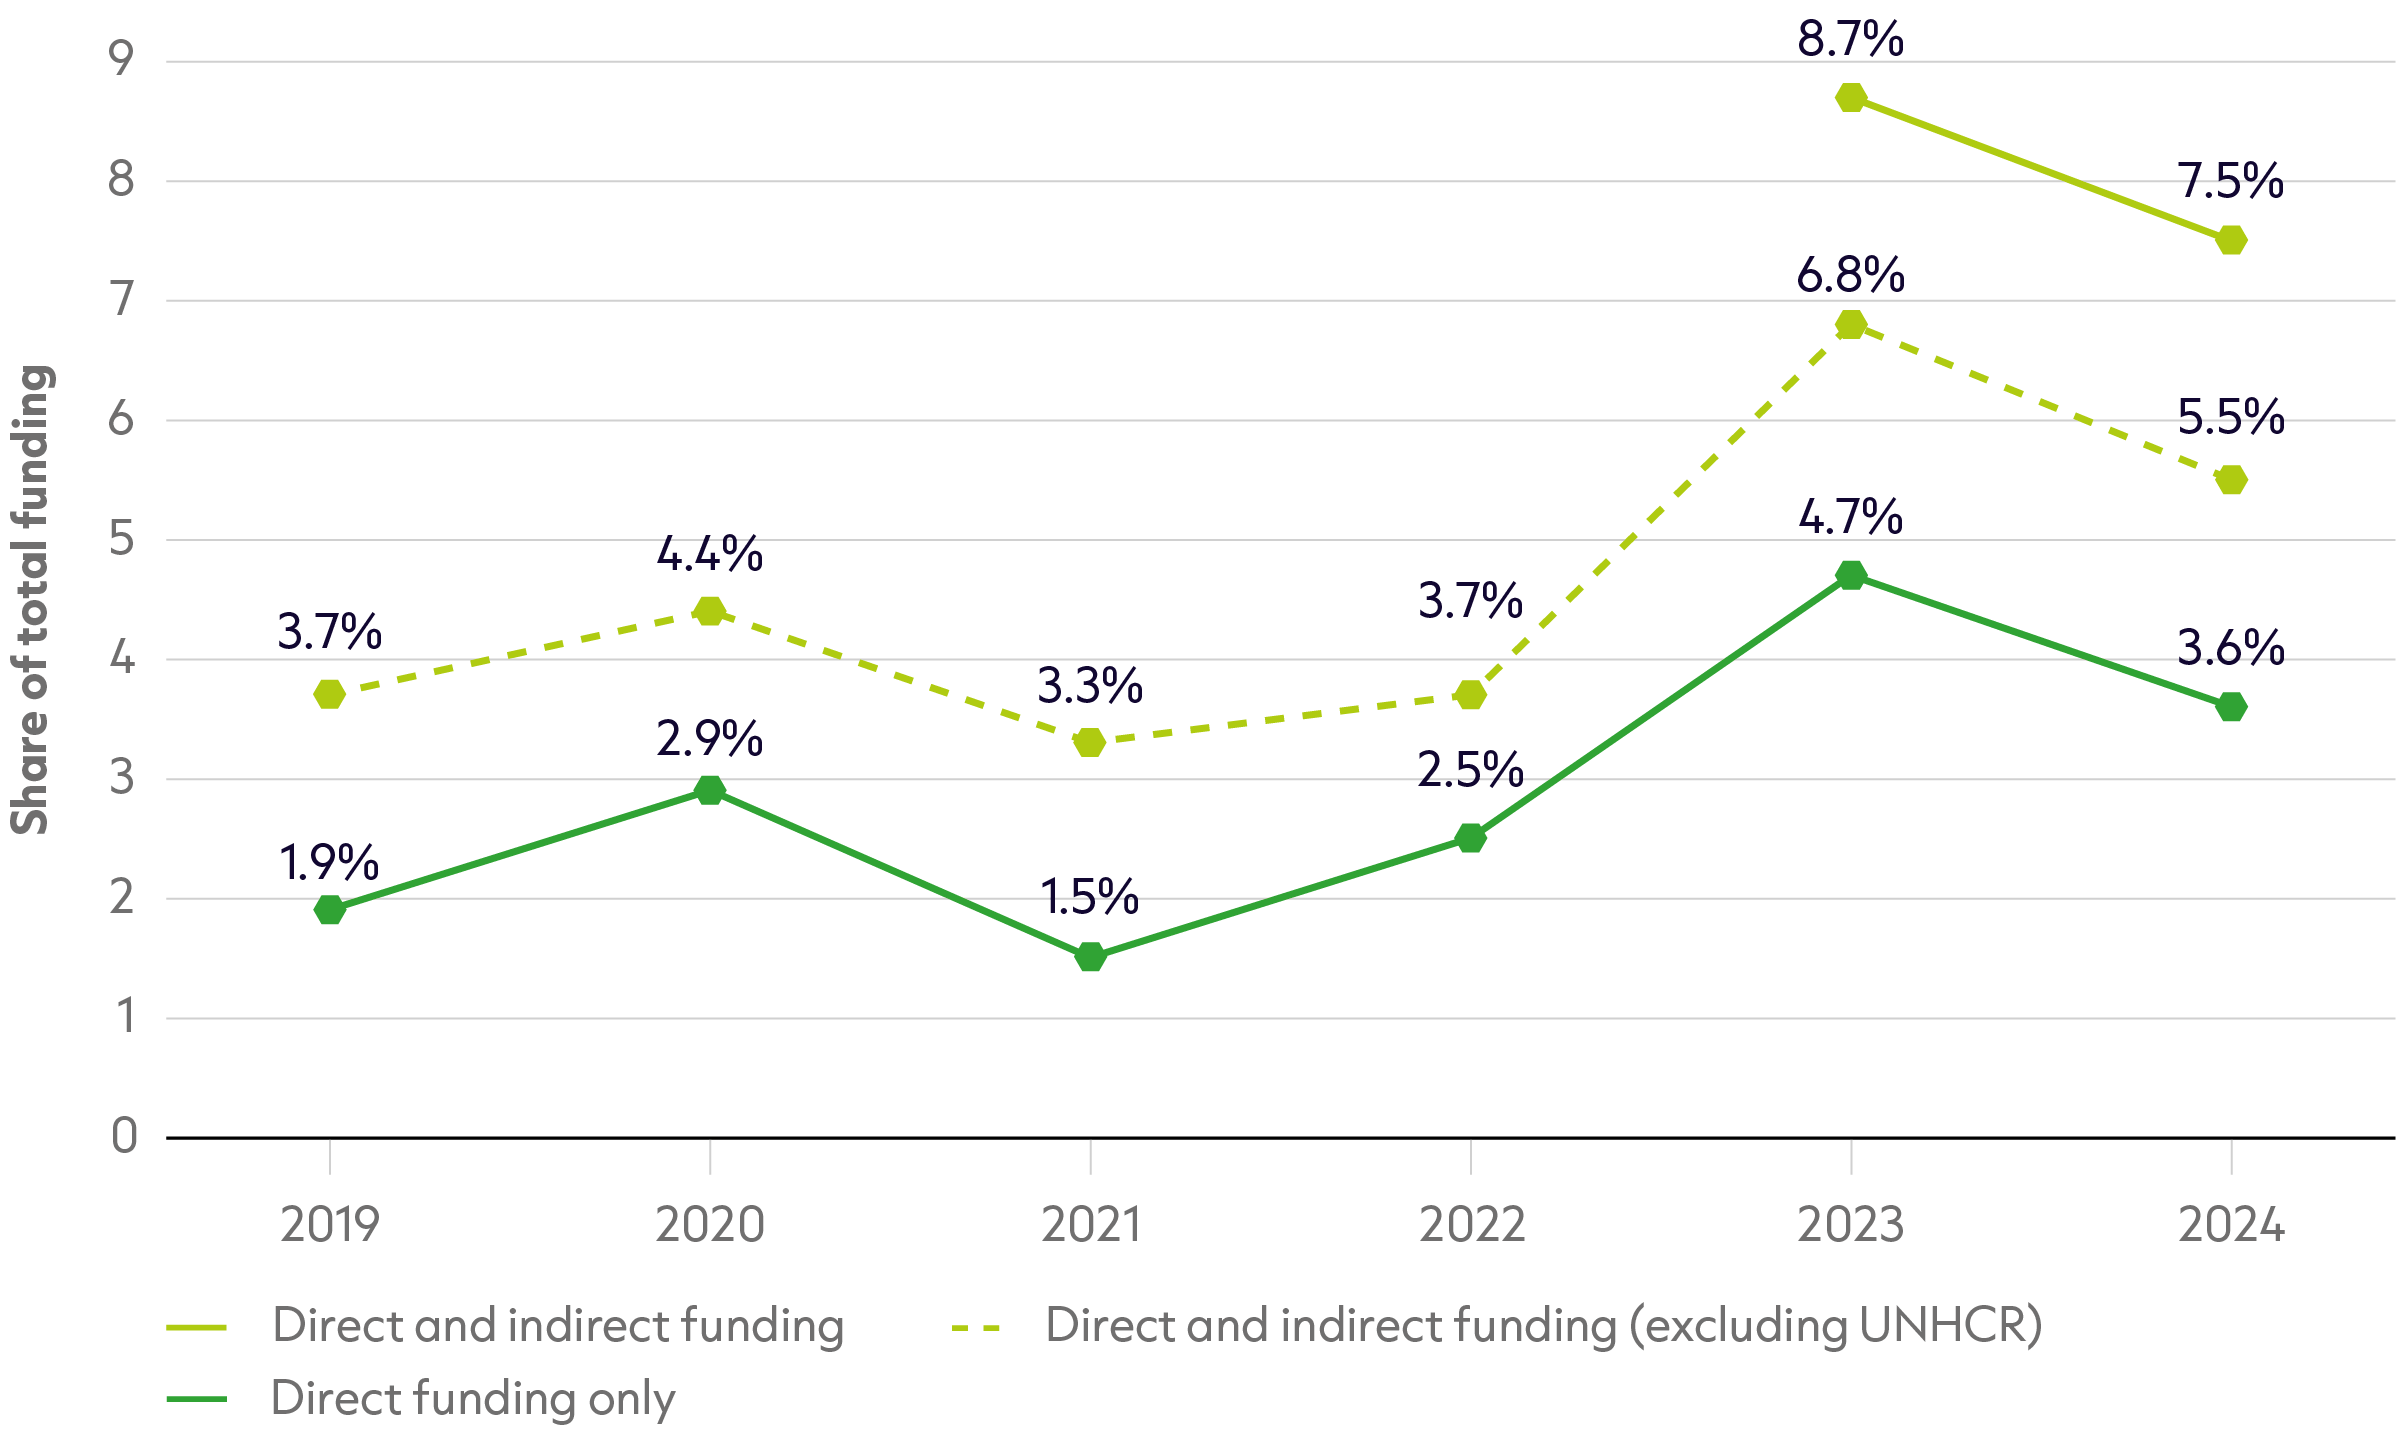
Figure 2.1: The share of international humanitarian assistance to local and national actors fell in 2024
Proportion of direct and total (direct and indirect) funding to local and national actors, 2019–2024
Source: Based on United Nations Office for the Coordination of Humanitarian Affairs (UN OCHA) Financial Tracking Service (FTS)
Notes: 2024 is the second year the United Nations High Commissioner for Refugees (UNHCR) has published granular data on its partnerships that can be independently verified against the Grand Bargain definitions of local and national actors, making only a direct comparison with 2023 possible. Comparisons across a longer period are done by excluding UNHCR.
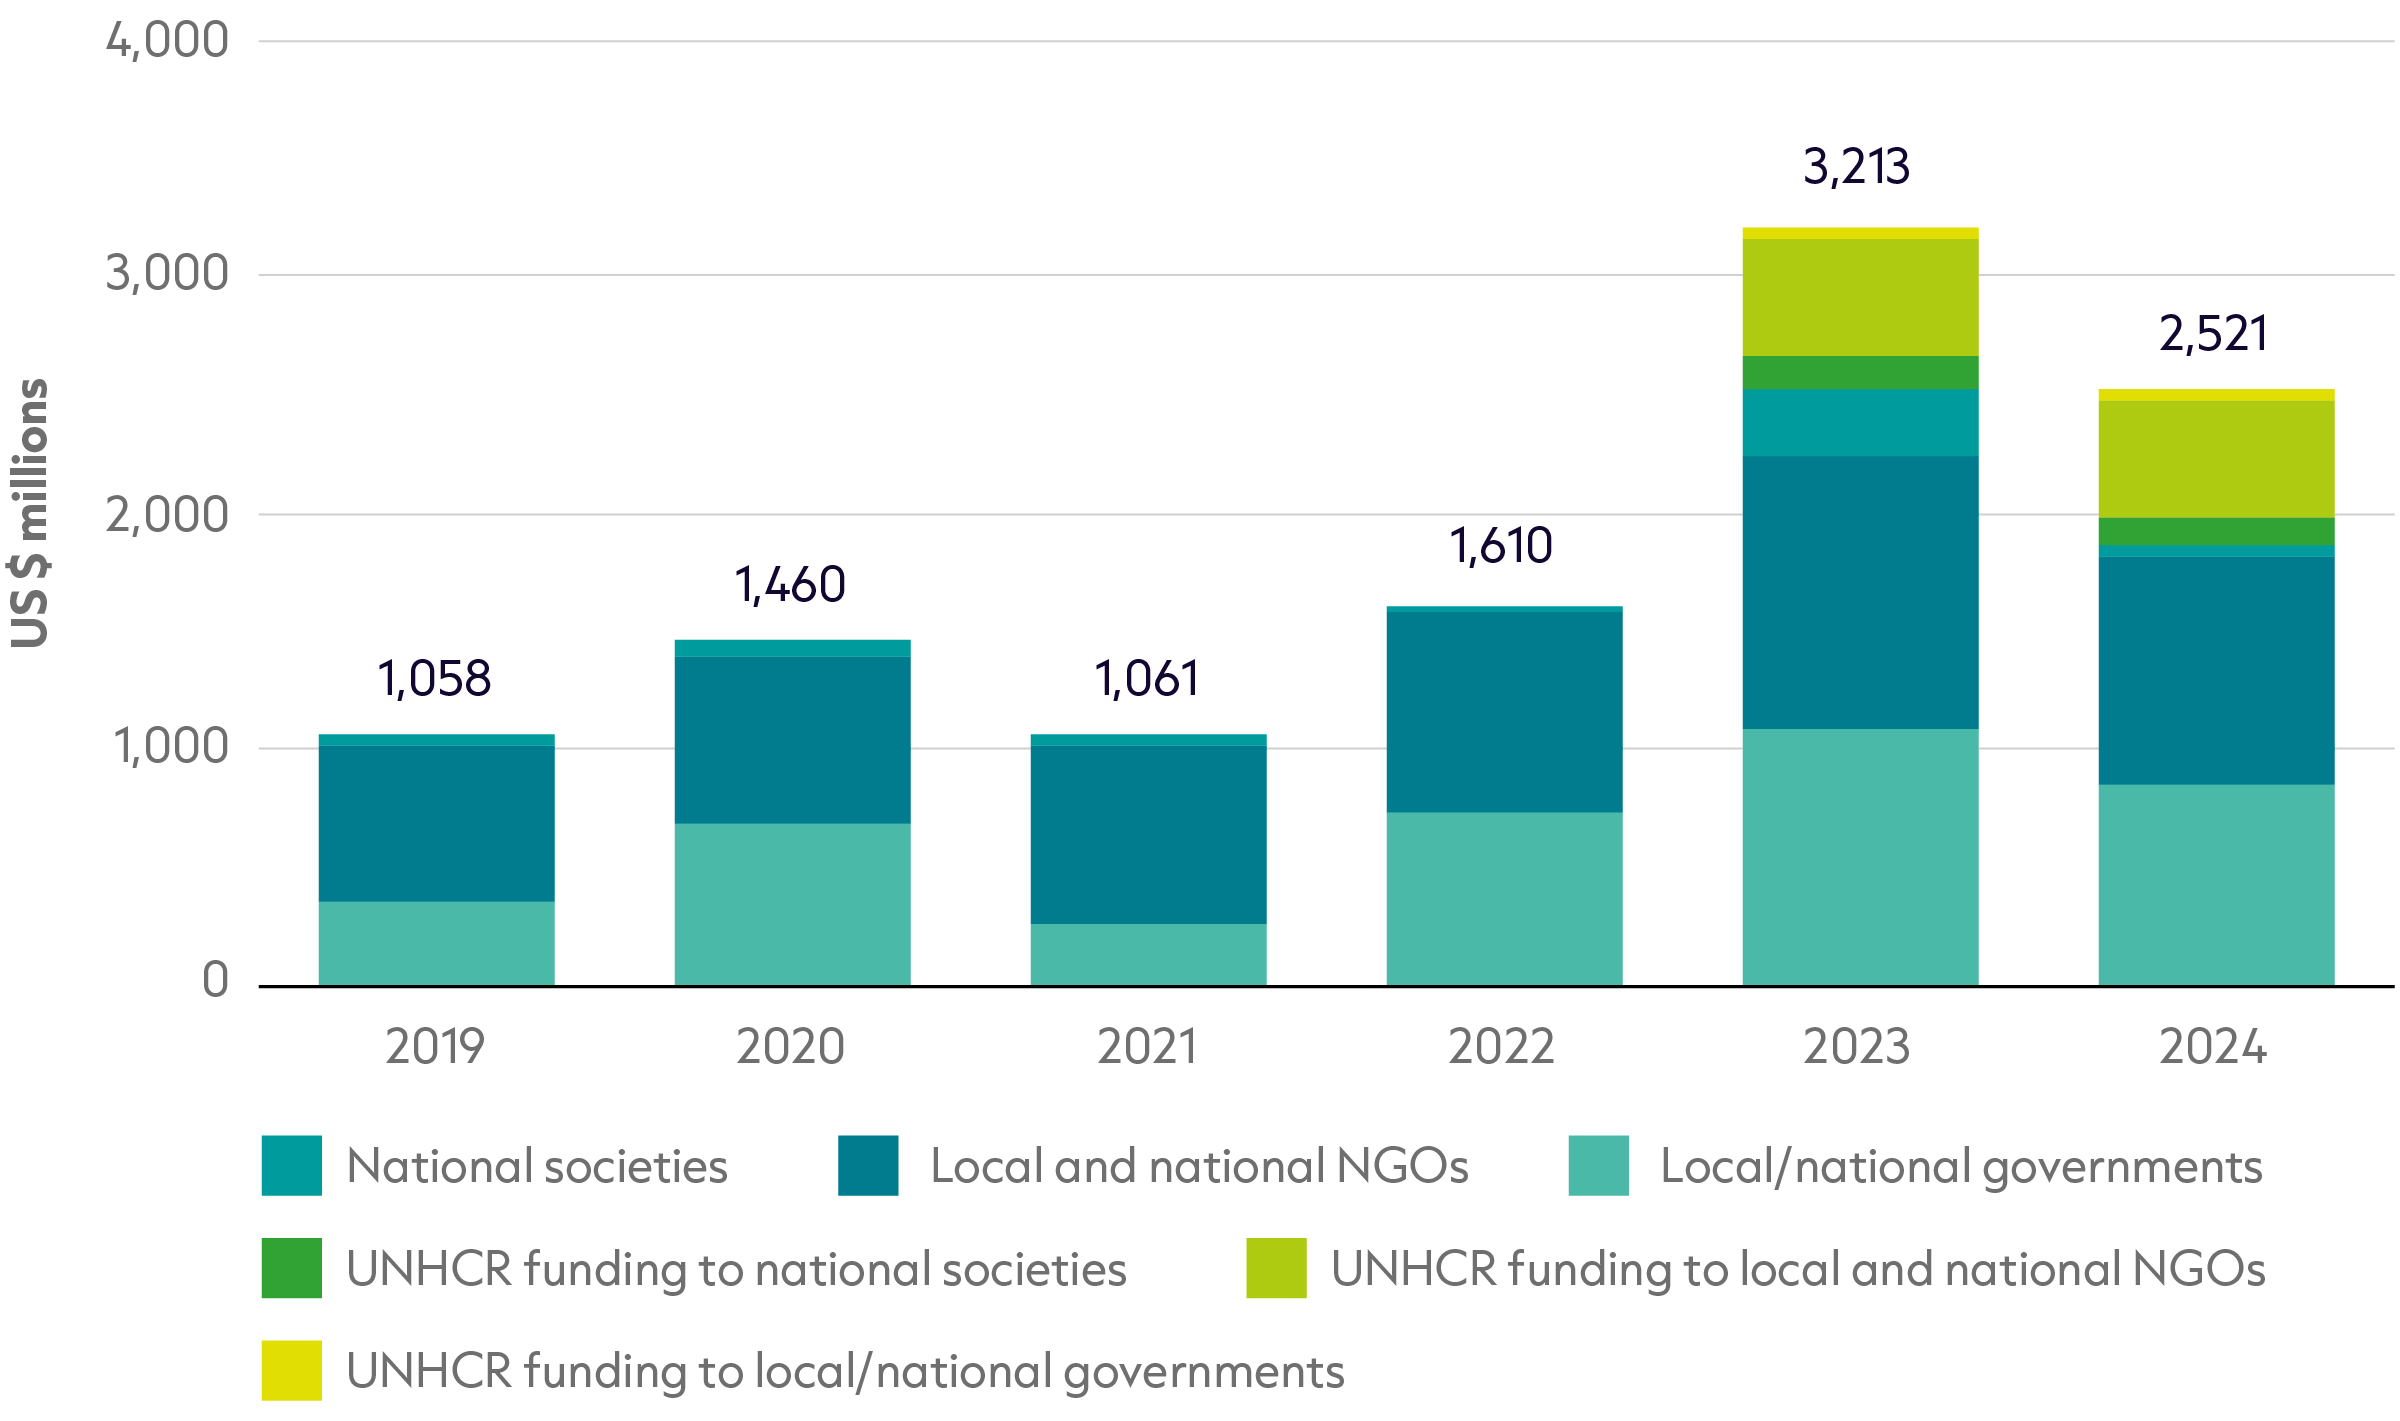
Figure 2.2: Total trackable funding to local and national actors fell by nearly a quarter in 2024
Breakdown of funding to local and national actors, 2019–2024
Source: Based on UN OCHA FTS.
Notes: 2024 is the second year UNHCR has published granular data on its partnerships that can be independently verified against the Grand Bargain definitions of local and national actors, making only a direct comparison with 2023 possible. Comparisons across a longer period are done by excluding UNHCR.
Funding to local and national actors is not increasing despite many years of sustained advocacy, donor commitments and policy reform efforts (see Figure 2.1). In 2024, trackable funding provided directly to local and national actors fell substantially, though it remained above 2022 levels. This was partly driven by a decrease in funding from Gulf actors for specific crises following improvements in their reporting in 2023. However, overall direct funding volumes remain paltry, and the system has failed to meaningfully shift funding patterns to the local level.
- In 2024, direct funding to local and national actors fell by 31%, to US $1.2 billion. As a proportion of total trackable international humanitarian assistance this represents just 3.6%.
- Improved reporting and inconsistent funding allocations of several Gulf donors have partly shaped this downward trend. The increase in funding in 2023 was mainly attributed to large funding flows totalling US $1 billion from the government of Saudi Arabia and the Red Crescent Society of the United Arab Emirates (previously very limited reporters to the Financial Tracking Service (FTS)), which fell again in 2024: US $89 million and US $227 million less, respectively.
- The lack of progress to increase funding to local and national actors is stark when just looking at the funding flows of Grand Bargain signatories. The volume and proportion of funding provided directly to local and national actors by this donor group fell to 0.5% (US $140 million) in 2024 from 0.6% (US $174 million) in 2023.
It is difficult to quantify how much additional funding trickles through the humanitarian system to local and national actors in order to assess the overall funding picture. While there have been improvements in transparency due to new reporting from the United Nations High Commissioner for Refugees (UNHCR) since 2023, there remains a critical information gap on the total volume of funding that reaches local and national actors through one or more intermediaries (see Figure 2.2). This makes it challenging to fully assess progress made against the Grand Bargain aggregate target of 25%, limiting accountability.
Assuming that reporting practices remained consistent between 2023 and 2024 – and the data ‘gap’ remained the same – it would seem that funding to local and national actors was disproportionately cut in 2024 compared to the sector as a whole. Total trackable funding to local and national actors fell by 22% in 2024 compared to the 11% contraction of the sector (see Figure 1.1).
- US $1.3 billion of indirect funding can be tracked to local and national actors in 2024, around half of which (US $662 million) is funding reported by UNHCR.
- Trackable direct and indirect funding totalled an estimated US $2.5 billion in 2024, a decrease of nearly a quarter (22%) from US $3.2 billion in 2023. This funding makes up 7.5% of all trackable humanitarian flows.
- The proportions of total funding to different local and national actor groups remained similar to previous years.
- Local and national non-governmental organisations (NGOs) remained the largest recipient group (58%) followed by government actors (39%). UNHCR reporting contributed over a third of funding to local and national NGOs, providing just over half a billion in 2023 and 2024.
- However while local and national governments received most funding directly from donors, local and national NGOs continued to receive the majority (79%) of international funding through at least one intermediary.
Looking forward, the announced budget cuts by key humanitarian donors will undoubtedly affect the slow progress made to increase funding to local and national actors. Until the recent decision to drastically reduce its official development assistance (ODA) budget, the US was leading the way on funding transparency, with a target to increase its funding to local and national actors to 25%. According to a memo published in March 2025 outlining decisions on United States Agency for International Development (USAID) award retentions and terminations, more than half (US $18 million) of direct humanitarian funding obligations to local actors in place at the beginning of 2025 were to be cut.[1] The memo suggested that across all sectors 66% of USAID awards to local and national actors would be axed, a much higher proportion than awards to international partners (39%), again implying a potentially disproportionate impact on local and national actors.
The impact of the funding cuts on local actors downstream of USAID’s international recipients is likely to be even greater and less visible given the lack of timely and public data on indirect funding. For instance, a survey by the NEAR Network (a network of local and national NGOs) found that, as of 10 February 2025, 83% of its members had paused their programmes due to the US funding cuts.[2]
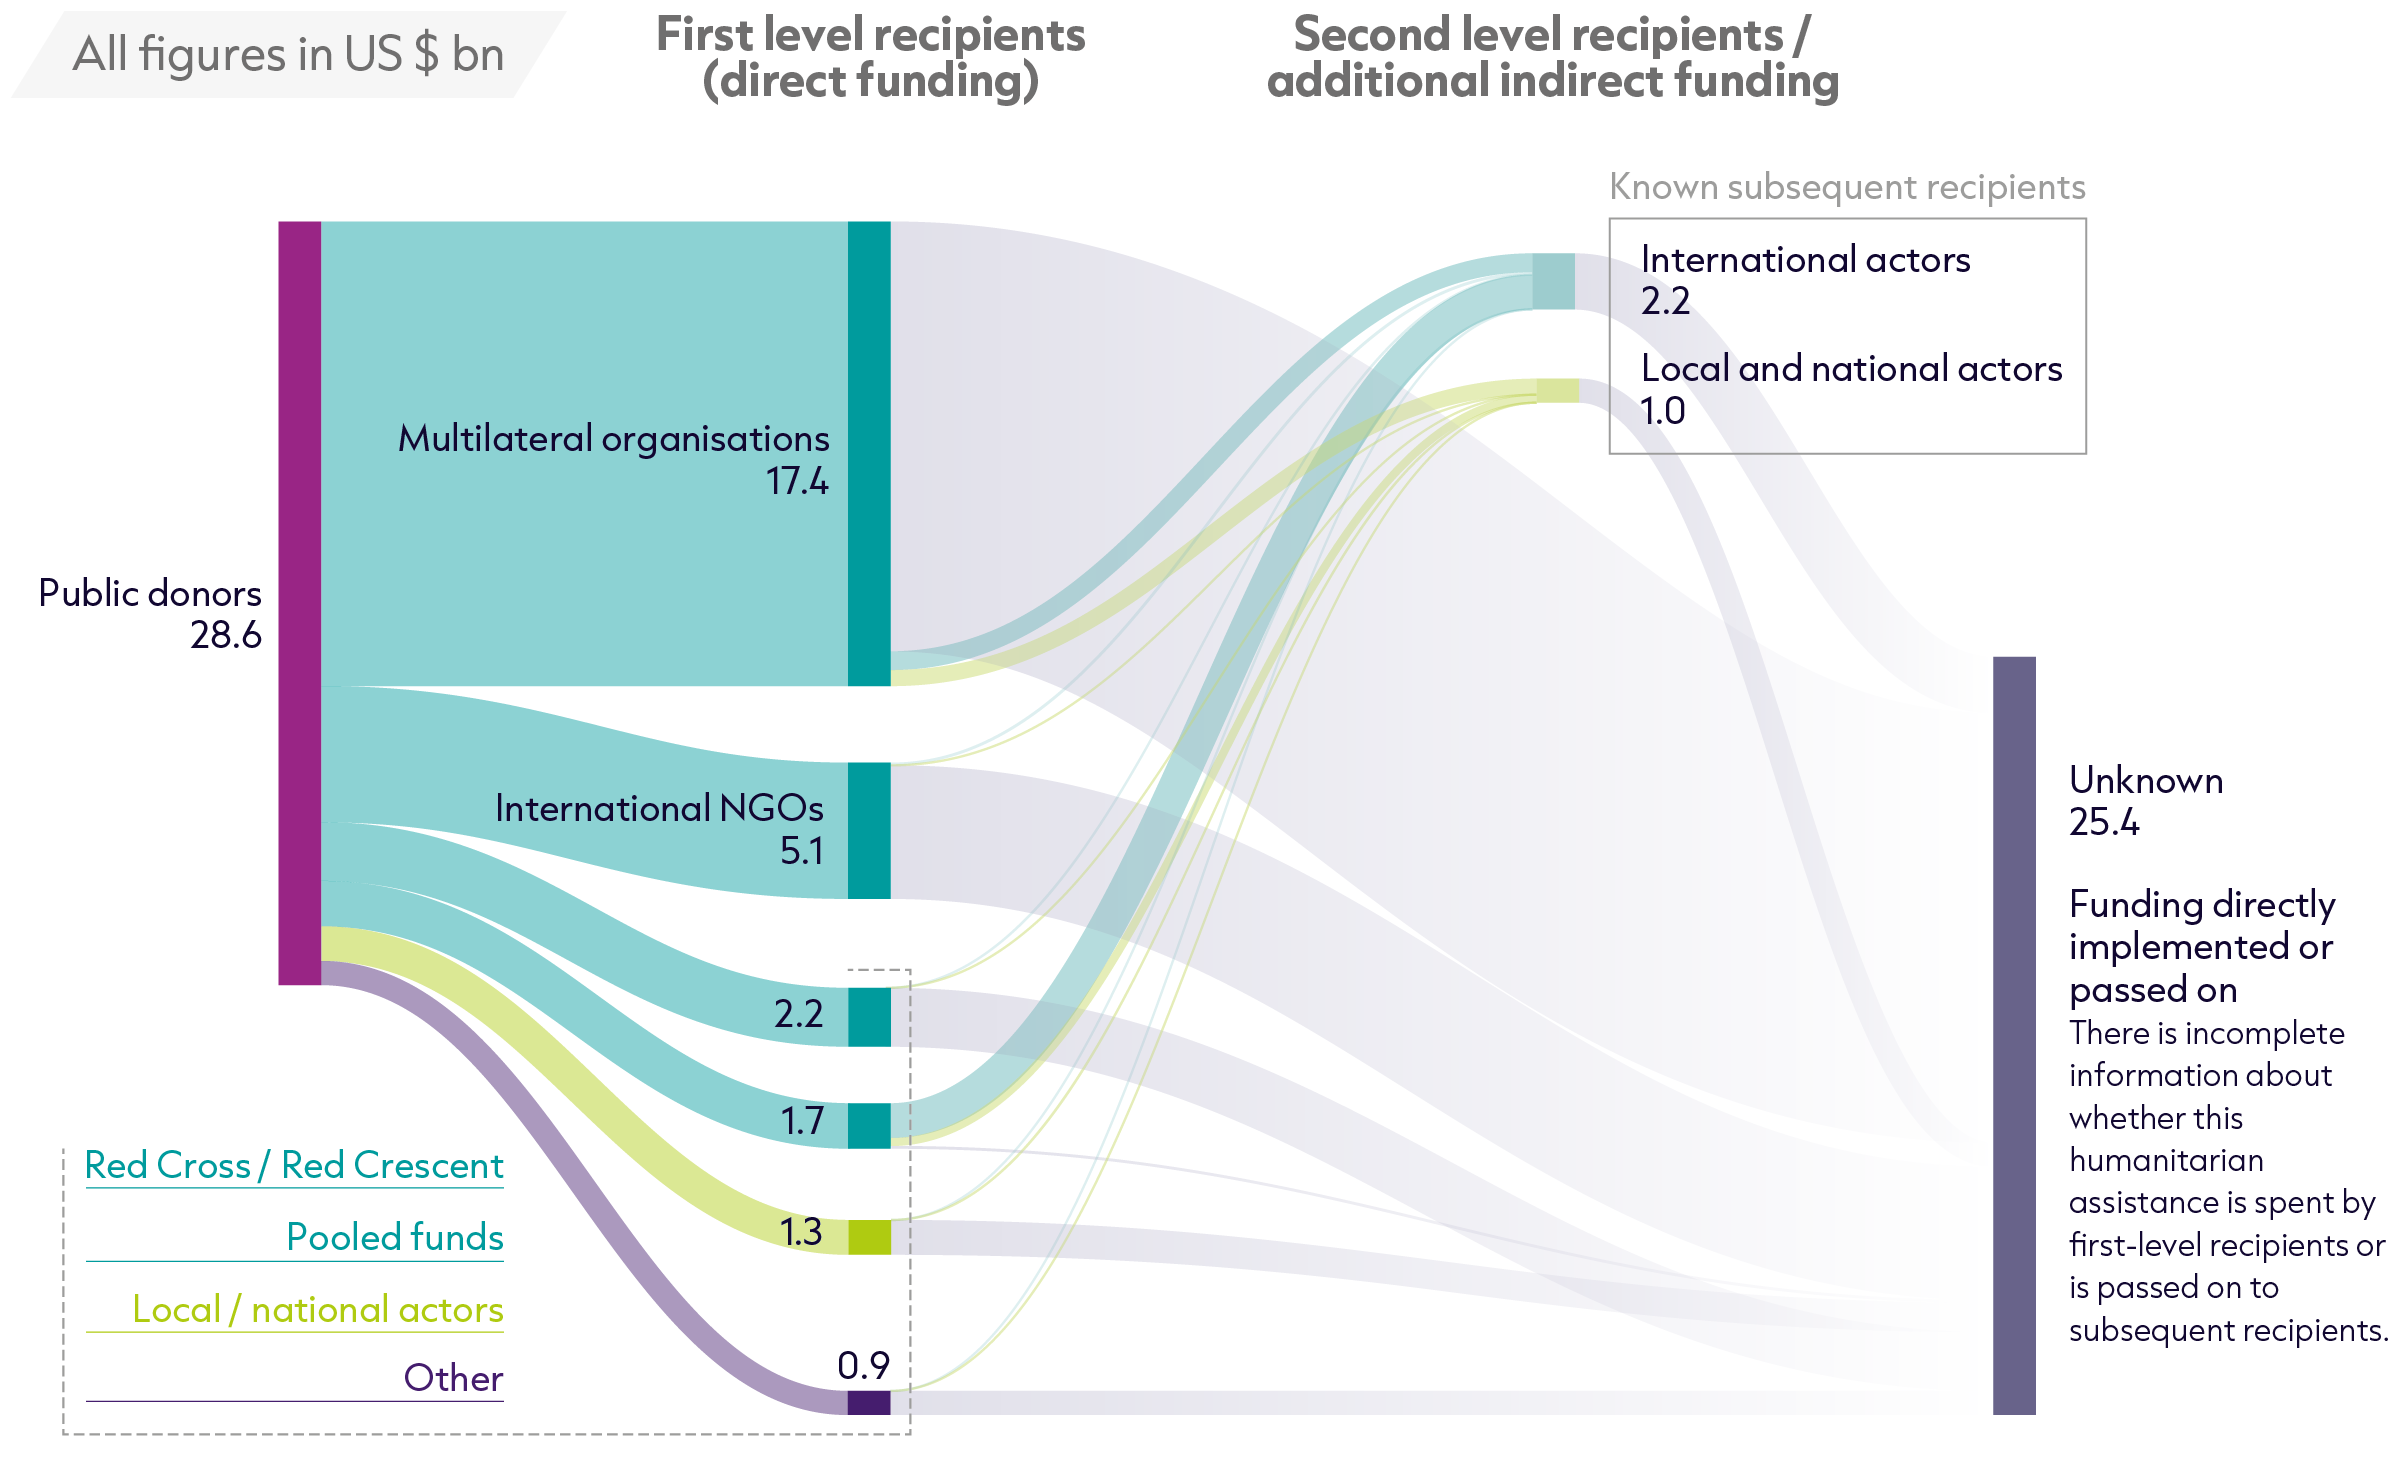
Figure 2.3: The majority of international humanitarian assistance continues to be channelled to multilateral organisations
Channels of delivery, 2024
Source: Based on UN OCHA FTS, CBPF data, CERF Data Hub, and UNHCR 2023 partner budget information.
Despite the substantial shifts in volumes of funding provided by donors for international humanitarian assistance (see Figure 1.1), how funding is channelled to crises has changed remarkably little over the past decade. Looking at the bigger picture, donors continue to provide the bulk of funding to multilateral organisations and international NGOs (INGOs).
- In 2024, 61% (US $17.4 billion) of public donor funding (as tracked by FTS, pooled funds and UNHCR data) was provided to multilateral organisations. The largest recipients were the World Food Programme (US $7.9 billion) and UNHCR (US $3.3 billion).
- After multilaterals, the largest recipient group was INGOs, which received 18% (US $5.1 billion) of primary donor funding.
This direct funding is either implemented by the recipient organisation or passed on to other humanitarian organisations, often through long funding chains. However, despite the fact there have been multiple multi-stakeholder processes to address this,[3] the sector still struggles to account for exactly how this funding moves through the system before reaching the targeted population. While agencies provide detailed reporting on implementing partnerships to their donors, this information is not made publicly available. It is therefore not known how the vast majority of funding (89%) received by first-level recipients is delivered – whether it is directly implemented or passed to other organisations. This lack of transparency hampers coordination, targeting and accountability. It also makes tracking commitments made to increase aggregate (direct and indirect) funding to local and national actors very challenging.
- Of the funding that could be tracked to secondary recipients in 2024, most (US $2.1 billion) was provided to other international actors. Just US $1.0 billion was tracked at the second tier to local and national actors – including local and national NGOs and local or national government bodies – of which most came from UNHCR (US $614 million) and UN pooled funds (US $334 million).
2.2: Are pooled funds increasing in use, and are they working for local and national actors?
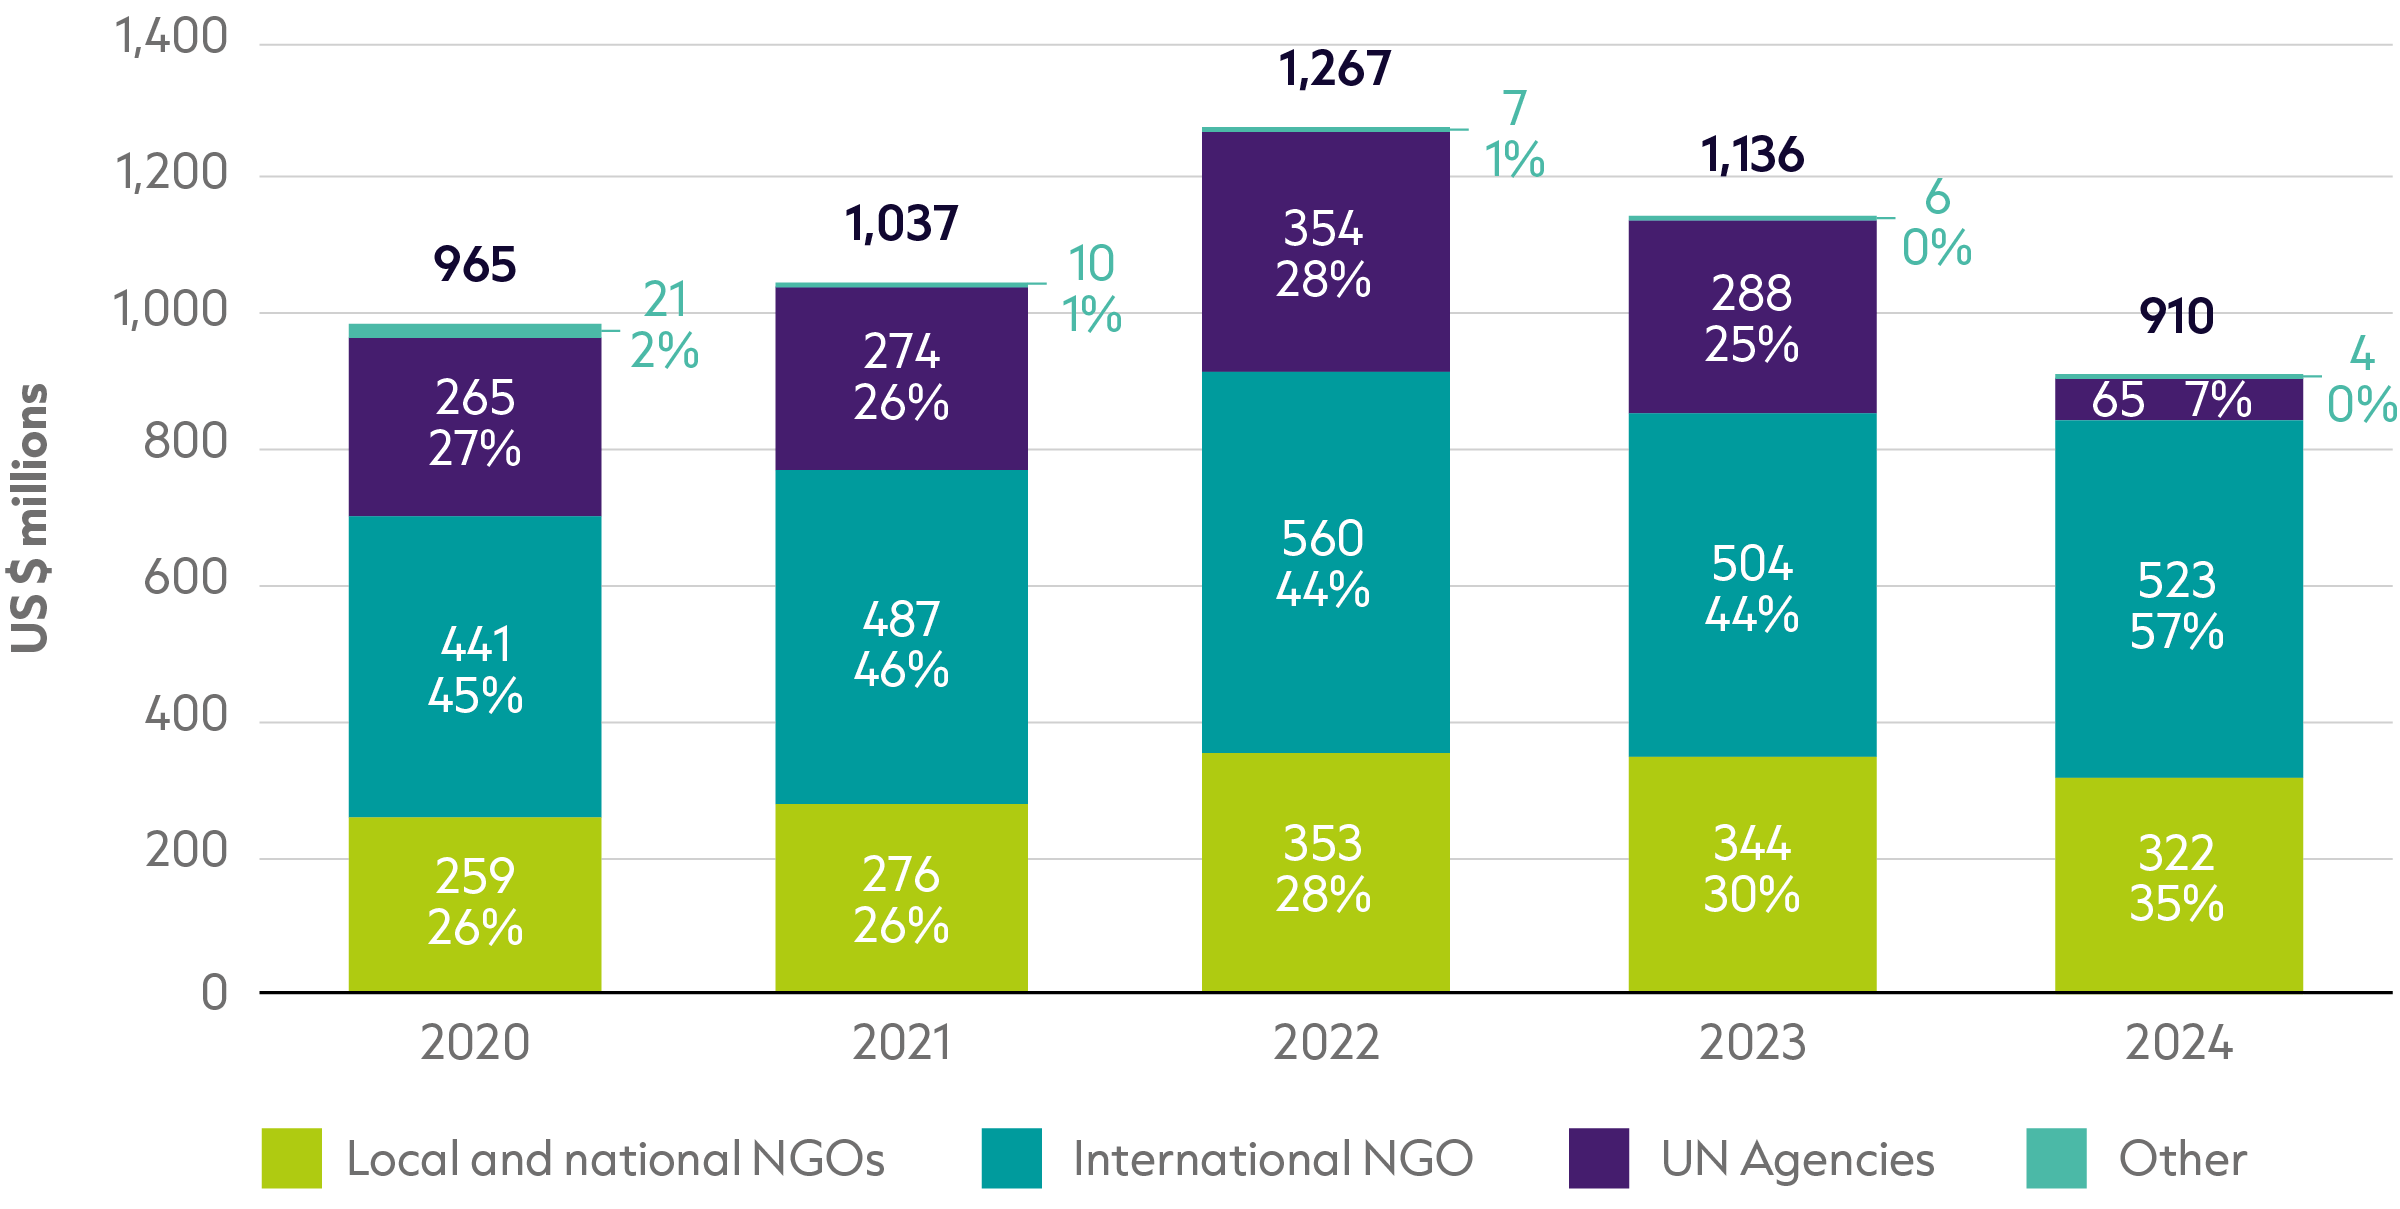
Figure 2.4: Total volumes allocated through CBPFs are decreasing
CERF and CBPF allocations by partner type, 2019–2024
Source: Based on CBPF data, CERF Data Hub and annual reports.
Notes: Data is in constant 2023 prices. 2024 subgrant data for CERF not currently available. Figures differ from previous GHA reports due to new data availability and deflation.
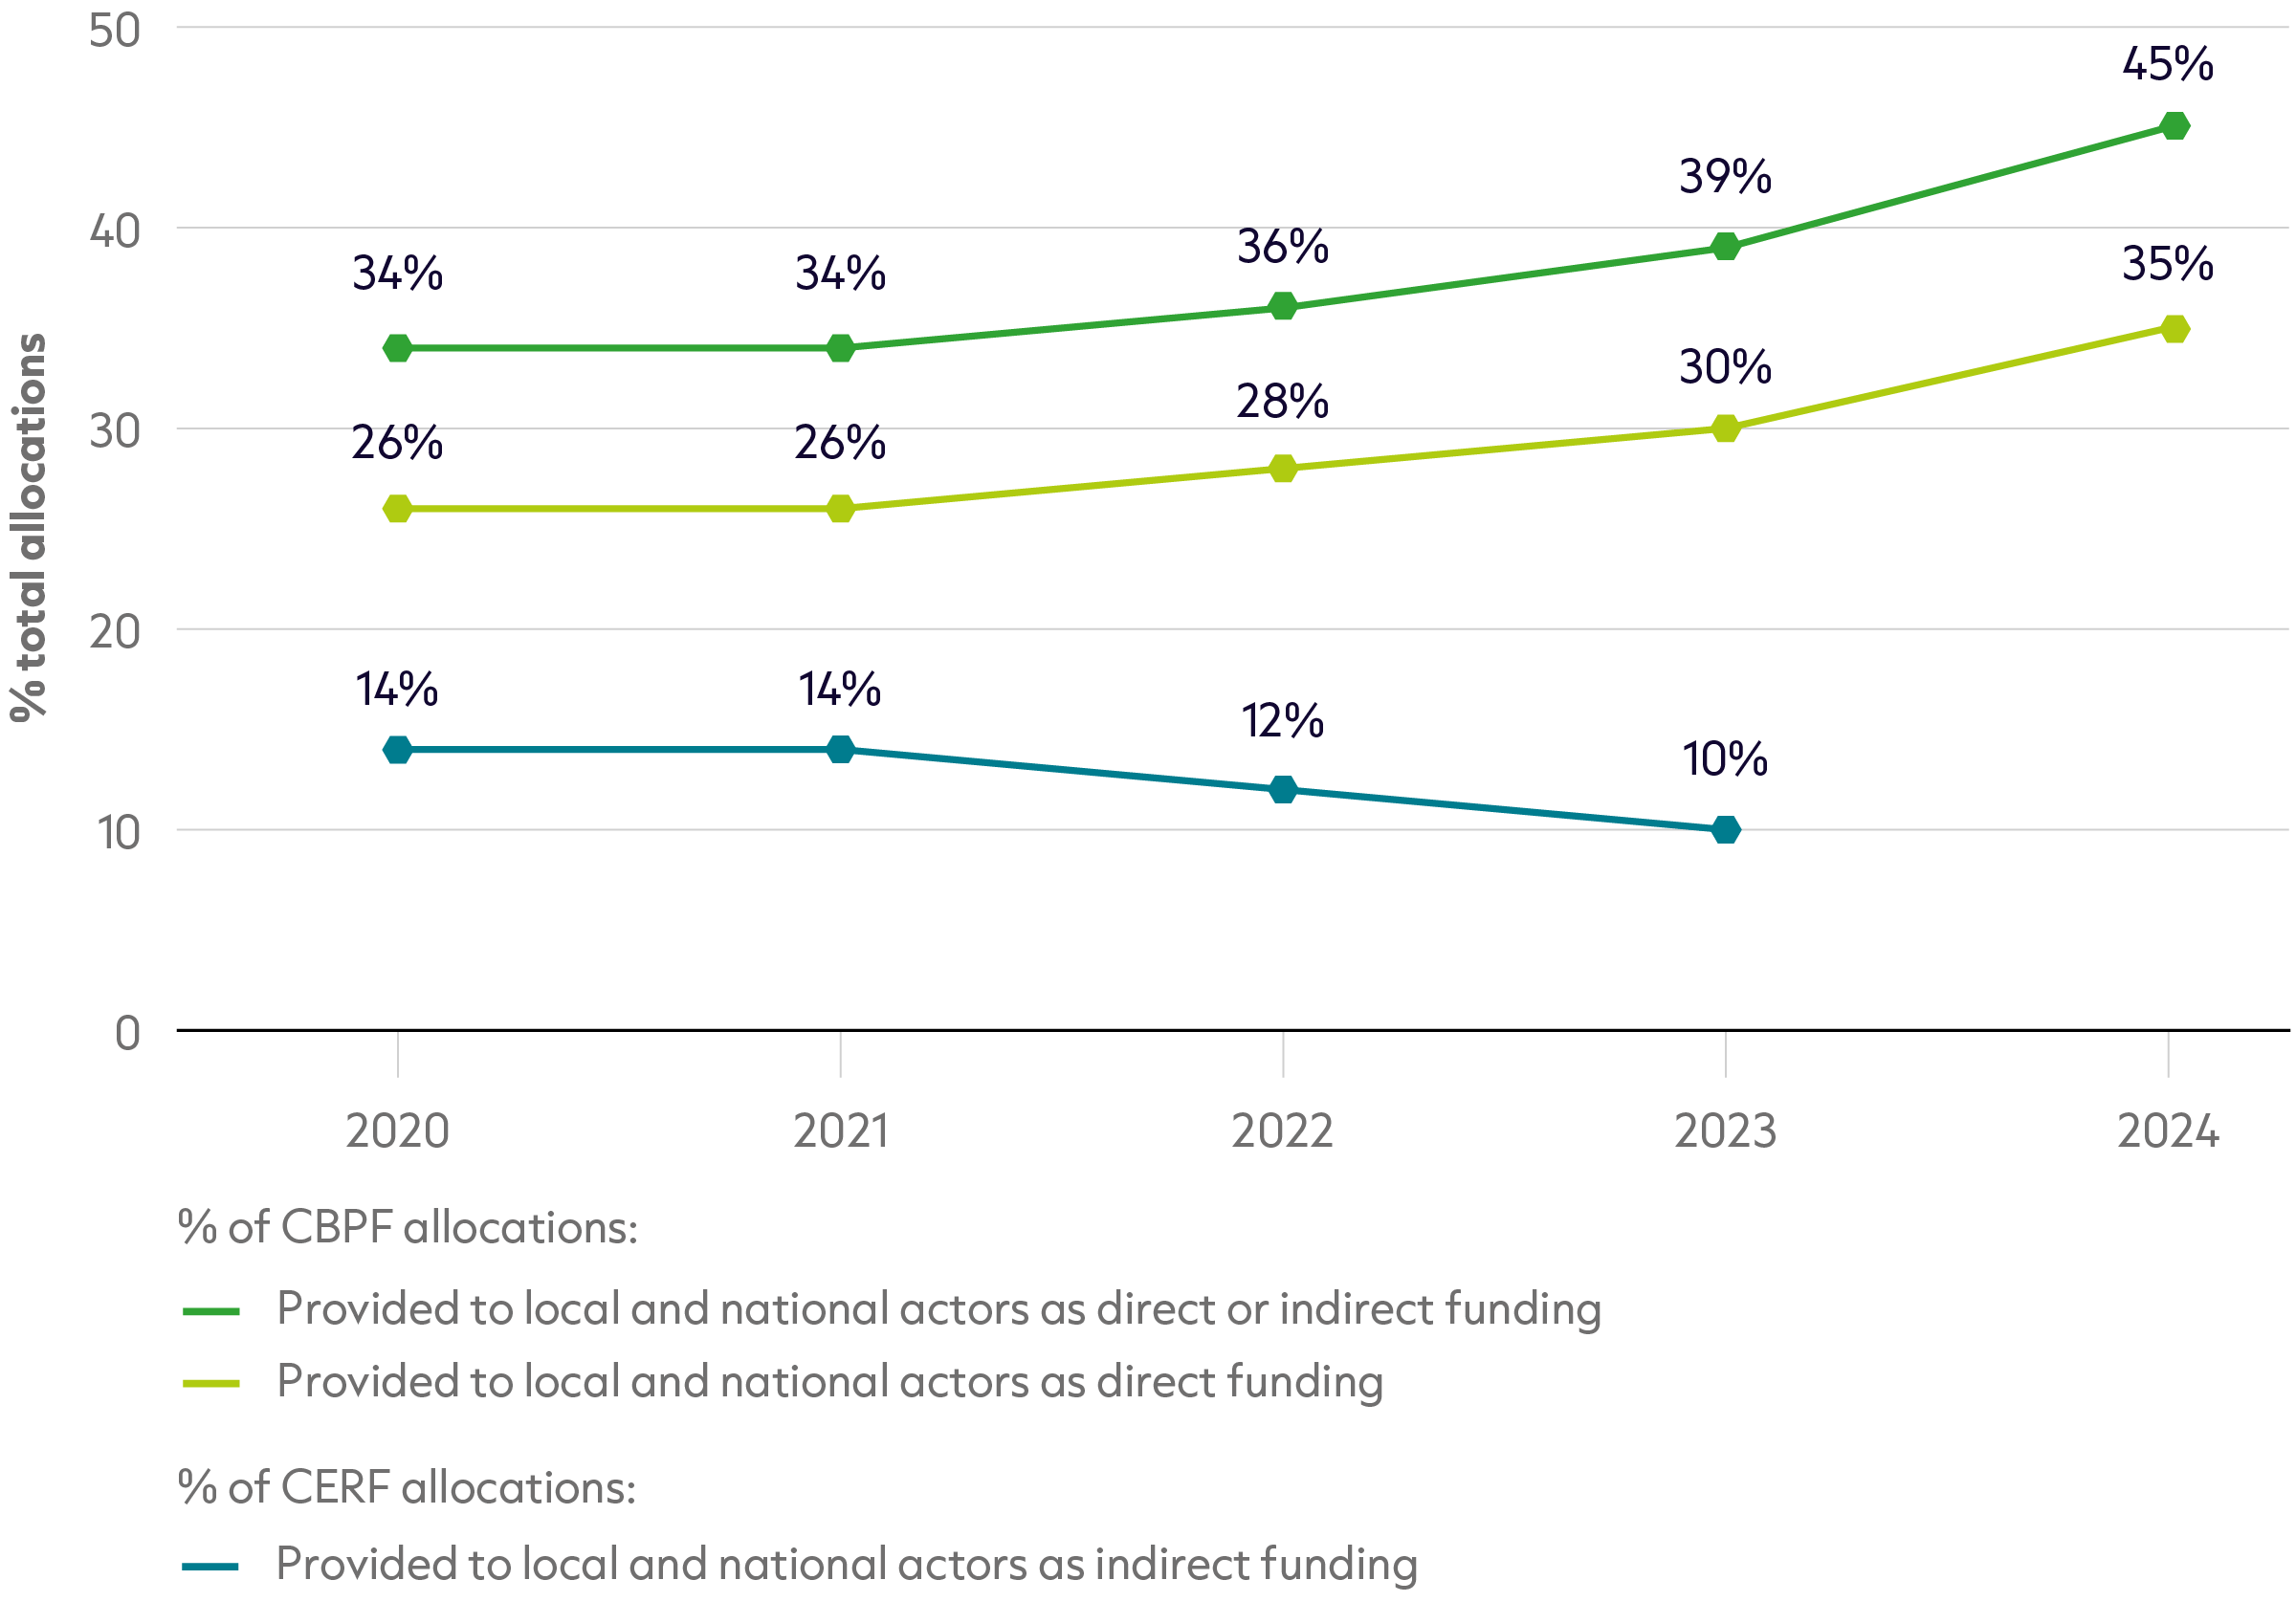
Figure 2.5: CBPFs are channelling a greater proportion of funding to local and national actors
CERF and CBPF share of allocations to local/national partners, 2019–2024
Source: Based on CBPF data, CERF Data Hub and annual reports.
Notes: Data is in constant 2023 prices. 2024 subgrant data for CERF is not currently available. Figures differs from previous GHA reports due to new data availability and deflation.
Pooled funding mechanisms have received increased focus over the past few years, yet the share of total donor funding delivered through them has not grown and remains small. In 2024, 6% (US $1.7 billion) of public donor funding was provided to UN pooled fund (see Figure 2.3) – little change from previous years.
Despite this, pooled funds are considered a key vehicle to localise more funding and promote more inclusive and locally led humanitarian action.[4] Efforts to increase the proportion of CBPFs provided to local and national actors have paid off to an extent – the UN OCHA-managed CBPFs channelled nearly half of its funding to local and national actors in 2024.
- CBPFs allocated 35% of funds (US $322 million) directly to local and national actors in 2024. Including sub-grants, total funding to local actors reached 45% (US $414 million), the highest share on record.
- As direct funding to local and national NGOs has increased, direct funding to UN agencies has fallen, from 25% in 2023 to 7% in 2024.
- The CBPFs allocating the largest proportion of funding directly to local and national actors were Colombia (100%), Somalia (78%) and Yemen (70%), while the lowest were Sudan (1%), Burkina Faso (16%) and Mali (21%).
Despite an increase in the proportion of CBPFs allocated to local and national actors, the overall volumes being allocated fell to below 2022 levels. In line with the overall reduction in humanitarian assistance (see Figure 1.1) most donors dropped their contributions to the CBPFs, some disproportionately so.
- Following a peak in 2022 (US $1.3 billion), funding allocations fell again in 2024 to US $914 million, a fall of 28%.
- The largest drops in funding provided between 2022 and 2024 were from the Afghanistan CBPF, which fell 82% (a US $244 million decrease) and the Syria cross-border CBPF, which fell 55% (a US $82 million decrease).
- There were large drops in contributions to the CBPFs from some key donors, disproportionate to their overall change in humanitarian spend (see Figure 1.3), including Germany, which halved its funding to the CBPFs to US $440 million in 2024 from US $213 million. In addition, UK funding fell by 10% from US $202 million to US $185 million, despite overall UK humanitarian spend increasing, and Canada funding fell by 60% from US $89 million to US $36 million.
Funding from the Central Emergency Fund (CERF) can only be allocated to UN agencies. Onward funding to local and national actors fell in 2023, along with overall volumes of CERF funding. This sub-granted funding does not technically count towards the Grand Bargain target as it is channelled through more than one intermediary.
- In 2023 (the latest year for which data is available), 10% (US $69 million) of CERF allocations were sub-granted to local and national actors. This is a decline from the period 2019–2021 when 14% of CERF funding was consistently localised.
- Overall allocations from the CERF fell to US $563 million in 2024, the lowest volume in the past six years.
Though overall volumes to the UN-managed pooled funds dropped in 2024, it is possible that this trend reverses in the context of donor cuts and shrinking budgets. Donors may choose to channel a larger proportion of funding through the pooled funds, as well-established mechanisms for funding local and national actors. Most recently, the Grand Bargain has proposed a target to channel more funding through pooled funds that directly fund local and national actors. A proposal to channel a third of international humanitarian assistance through the CBPFs has also been tabled as part of the Emergency Relief Coordinator’s call for a humanitarian reset (see Box 2.1).[5]
As well as the UN OCHA-managed funds, there are several other pooled funds that are growing in support including NGO-led and locally led pooled funds that aim to provide greater autonomy to local actors.
- The UN Women-managed Women’s Peace and Humanitarian Fund has disbursed US $249 million to local and national civil society organisations since it was established in 2016.[6] In 2023, US $46 million was mobilised through the fund, of which the majority (87%) was channelled to local and grassroots civil society organisations. Nearly half of these had never before received financing from the UN.[7]
- Through its country-based and global pooled fund, the Start Network disbursed £27.2 million (US $33.8 million) in 2023, of which 43% was channelled directly and indirectly to local and national organisations.[8]
- In 2025, Network for Empowered Aid Response (NEAR) launched a new Bridge Funding Window within its Change Fund to specifically support NEAR members, 83% of whom have been affected by the freeze on United States Agency for International Development (USAID) spending.[9]
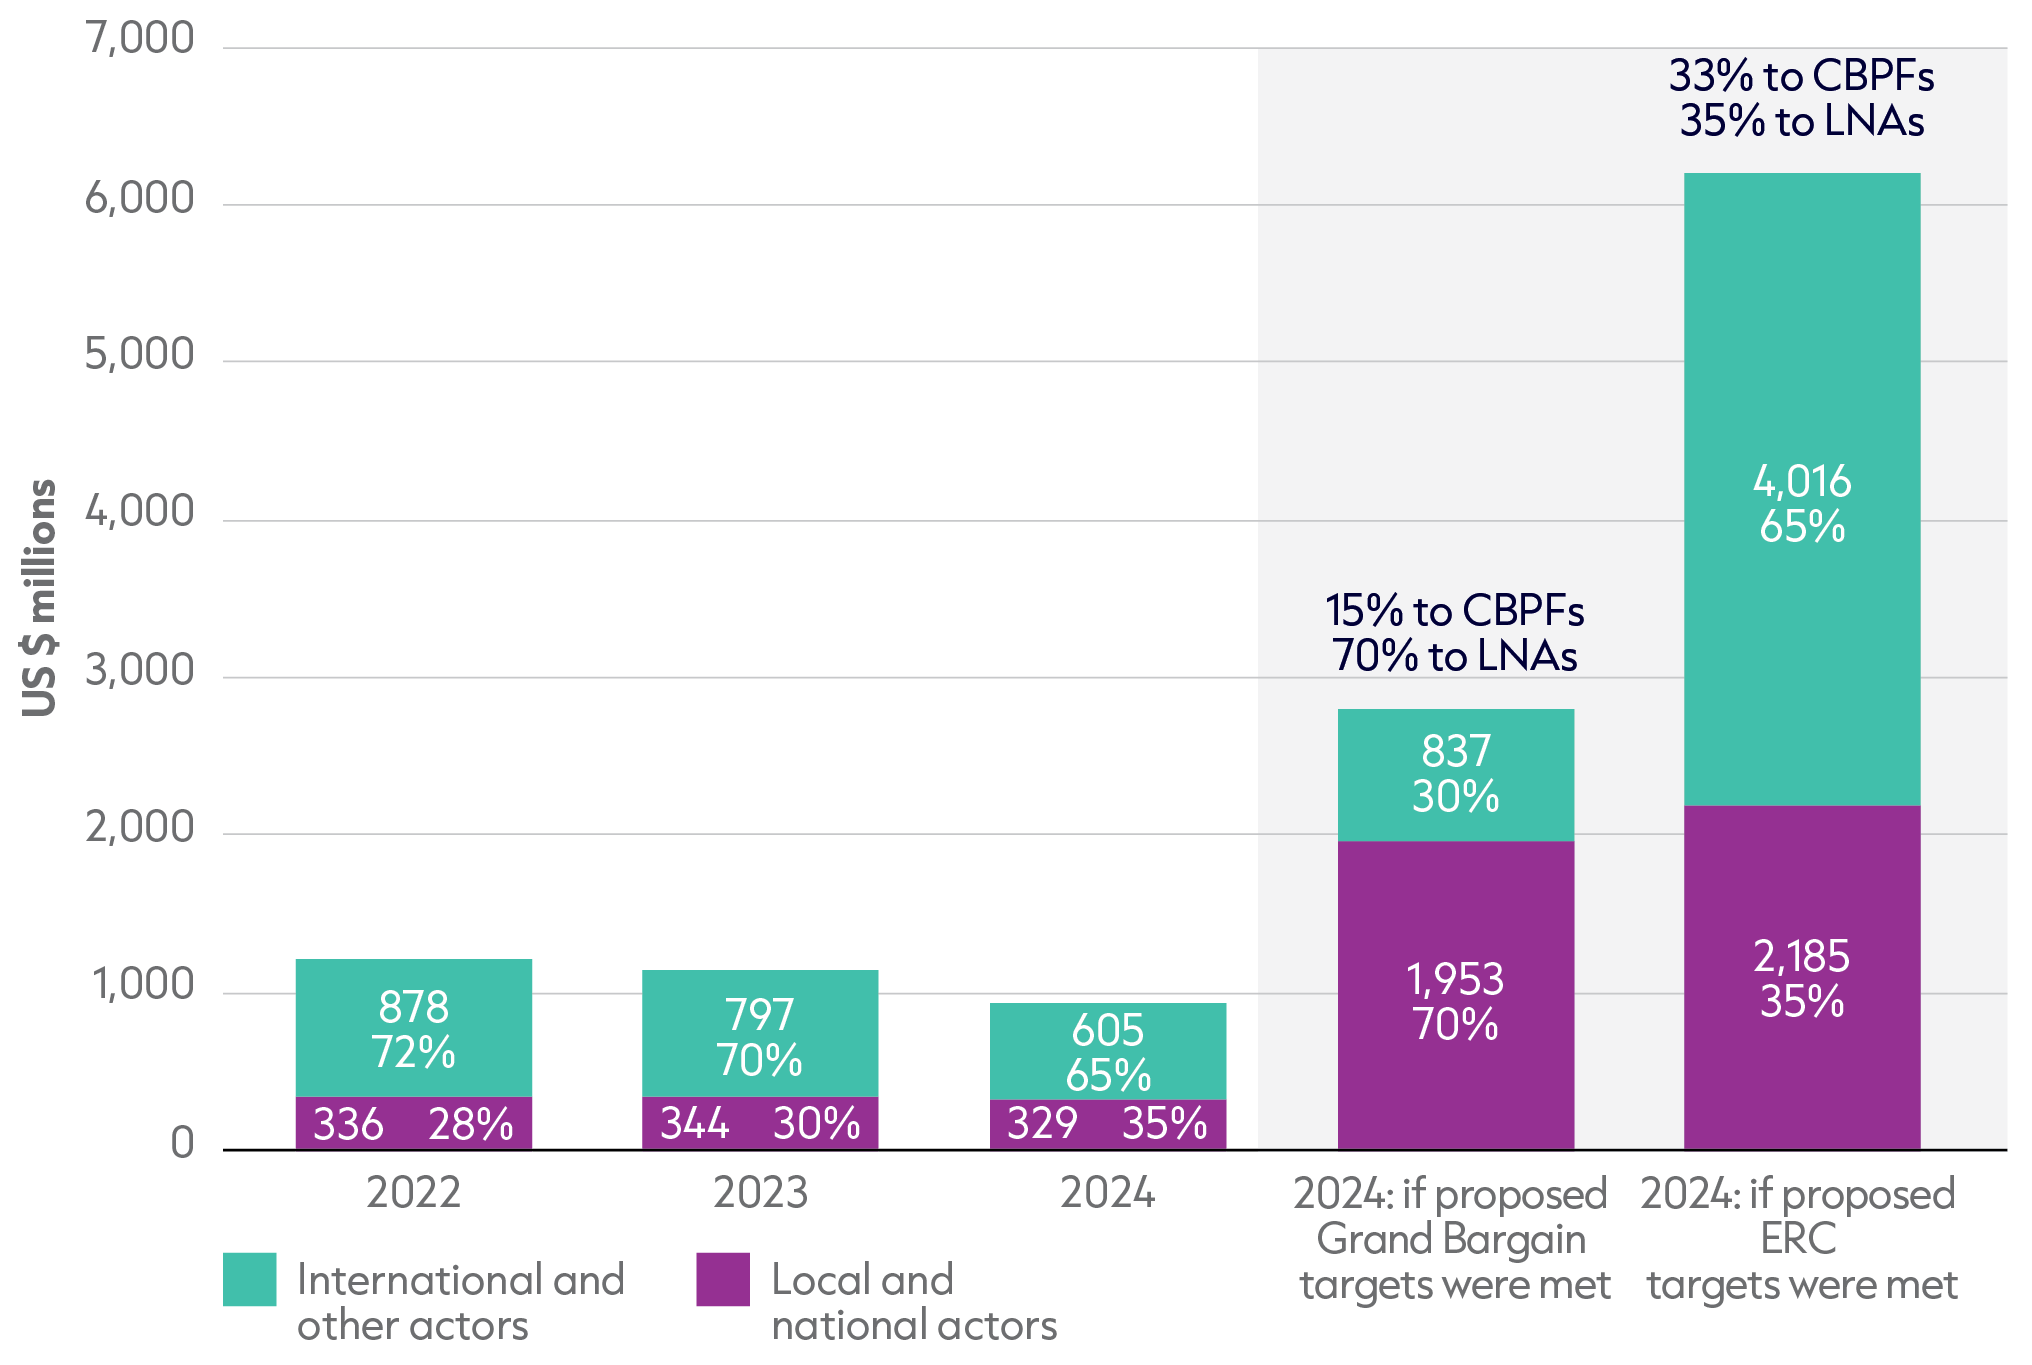
Source: ALNAP based on data from the UN OCHA CBPF data hub.
Notes: Figures presented in Figure 2.6 differ from those in Figure 2.4 due to the use of current prices. Scenarios presented represent proposals by the Grand Bargain and the Emergency Relief Coordinator (ERC). Under the Grand Bargain proposal, 15% of humanitarian response plan (HRP) funding would be secured for CBPFs, of which 70% would go directly to local and national actors. Tom Fletcher, the ERC, proposed in a speech on 15 May 2025 that a third of funding should go through CBPFs. Because no specific target for local and national actors was mentioned, the current percentage of direct funding to local and national actors (35%) was assumed. For more details regarding the methodology of this scenario refer to the ‘Methodology and definitions’ chapter.
2.3: How much funding was available for anticipatory action?
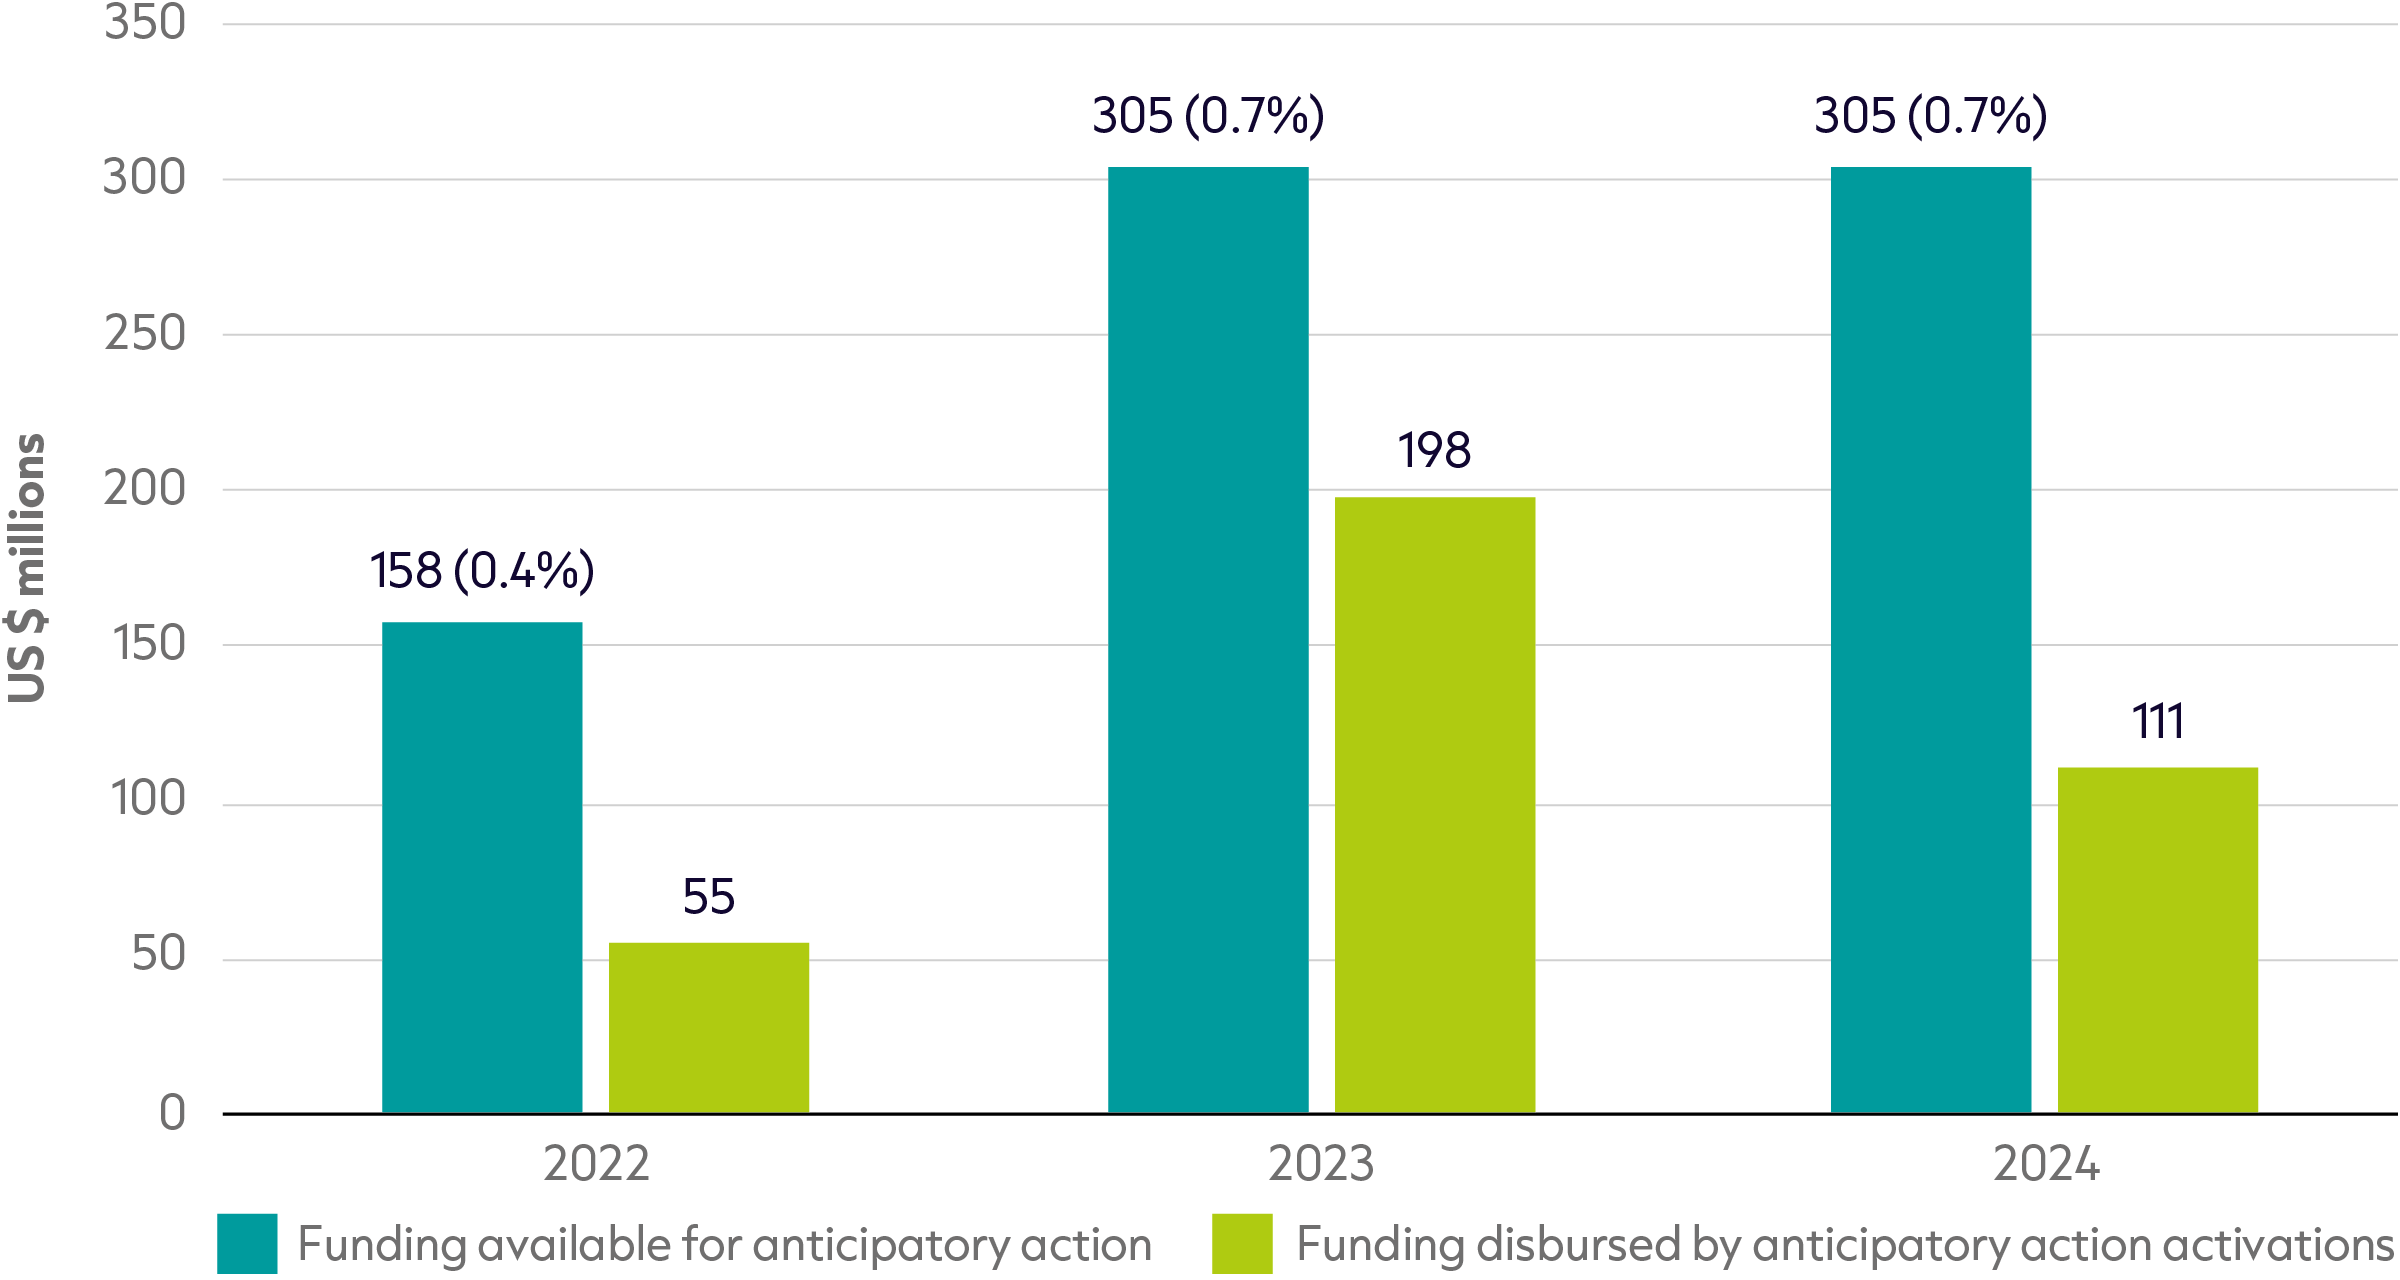
Figure 2.7: Growing policy support for anticipatory action has not yet translated into a growth in funding
Total budget available for anticipatory action frameworks and disbursed through activations, and proportion of international humanitarian assistance, 2022–2024
Source: ALNAP based on Anticipation Hub data.
Notes: ALNAP adapted the Anticipation Hub dataset by including missing activations in the active frameworks data for any given year. Caps on the total amount available under UN OCHA-coordinated frameworks in specific contexts have been taken into account to avoid double counting. Additional funding for frameworks under development (but nevertheless available) have been included in the total for 2024.
Around one-fifth of humanitarian response needs are the result of highly predictable shocks.[12] Anticipatory action – one form of pre-arranged finance – provides pre-agreed support in the window between a shock warning and its impact, much earlier than more traditional crisis response mechanisms. Anticipatory action has seen growing support from the humanitarian community as one means to shift towards a more proactive and risk-informed response model that limits humanitarian needs while also protecting development gains. The evidence base on the cost-effectiveness and efficiency of this approach is developing,[13] with one Food and Agriculture Organization study finding that every US dollar invested in anticipatory action yields up to US $7 dollars in avoidable losses.[14]
Despite the growing interest and support for anticipatory action, the volume of funding made available for anticipatory action frameworks stagnated in 2024 (US $305 million) and the volume disbursed fell (US $111 million) from the previous year despite the number of activations increasing. The overall reduction in total international humanitarian assistance meant there was a marginal increase in the share of anticipatory action funding, but this remained at just 0.7% of total international humanitarian assistance in 2024, a marginal increase from 0.3% in 2022 and 0.6% in 2023.
- The number of anticipatory action framework activations steadily increased from 47 activations in 2022 to 124 in 2024, predominantly for weather-related events. Despite this, the average disbursement per activation fell from US $2 million in 2023 to US $892,000 in 2024.
- In total, 56 countries had anticipatory action funding available to them in 2024 but the majority of total funding activated (72%) was absorbed by a small number of countries (Ethiopia, Somalia, Bangladesh, Mozambique, Madagascar, Niger and Chad).
- The UN remain the largest coordinating body of anticipatory action frameworks. In 2024, 83% of the total value was made available to UN-managed frameworks, followed by INGOs (10%) and the Red Cross and Red Crescent movement (6%). There is limited data on the involvement of local and national actors in anticipatory action frameworks as detailed in the report Falling Short? Humanitarian funding and reform.[15]
Despite the growing frequency and predictability of climate-related shocks, the potential of anticipatory action remains unrealised. To advance progress, a Grand Bargain caucus on scaling up anticipatory action was established in 2024, which agreed a common definition and established a methodology for tracking funding for anticipatory action. Donors also agreed to ‘substantially’ increase funding for anticipatory action and are encouraged to set individual targets of 5% of humanitarian budgets, in line with the G7 commitments.[16] There is also an emphasis on the provision of ‘fuel’ money – the financing channelled through anticipatory action frameworks – as donors have previously provided greater support for ‘build’ money – the financing required to establish and maintain anticipatory action frameworks.
It is unclear the extent to which support for anticipatory action will be continued or sidelined as the current funding crisis challenges policy priorities. However, as the humanitarian community seeks to double-down on efficiency measures, the full potential of anticipatory action to shift towards a more proactive response that mitigates the humanitarian impacts of predictable hazards while building resilience to future shocks remains untapped.
2.4: How much support is delivered by cash and voucher assistance?
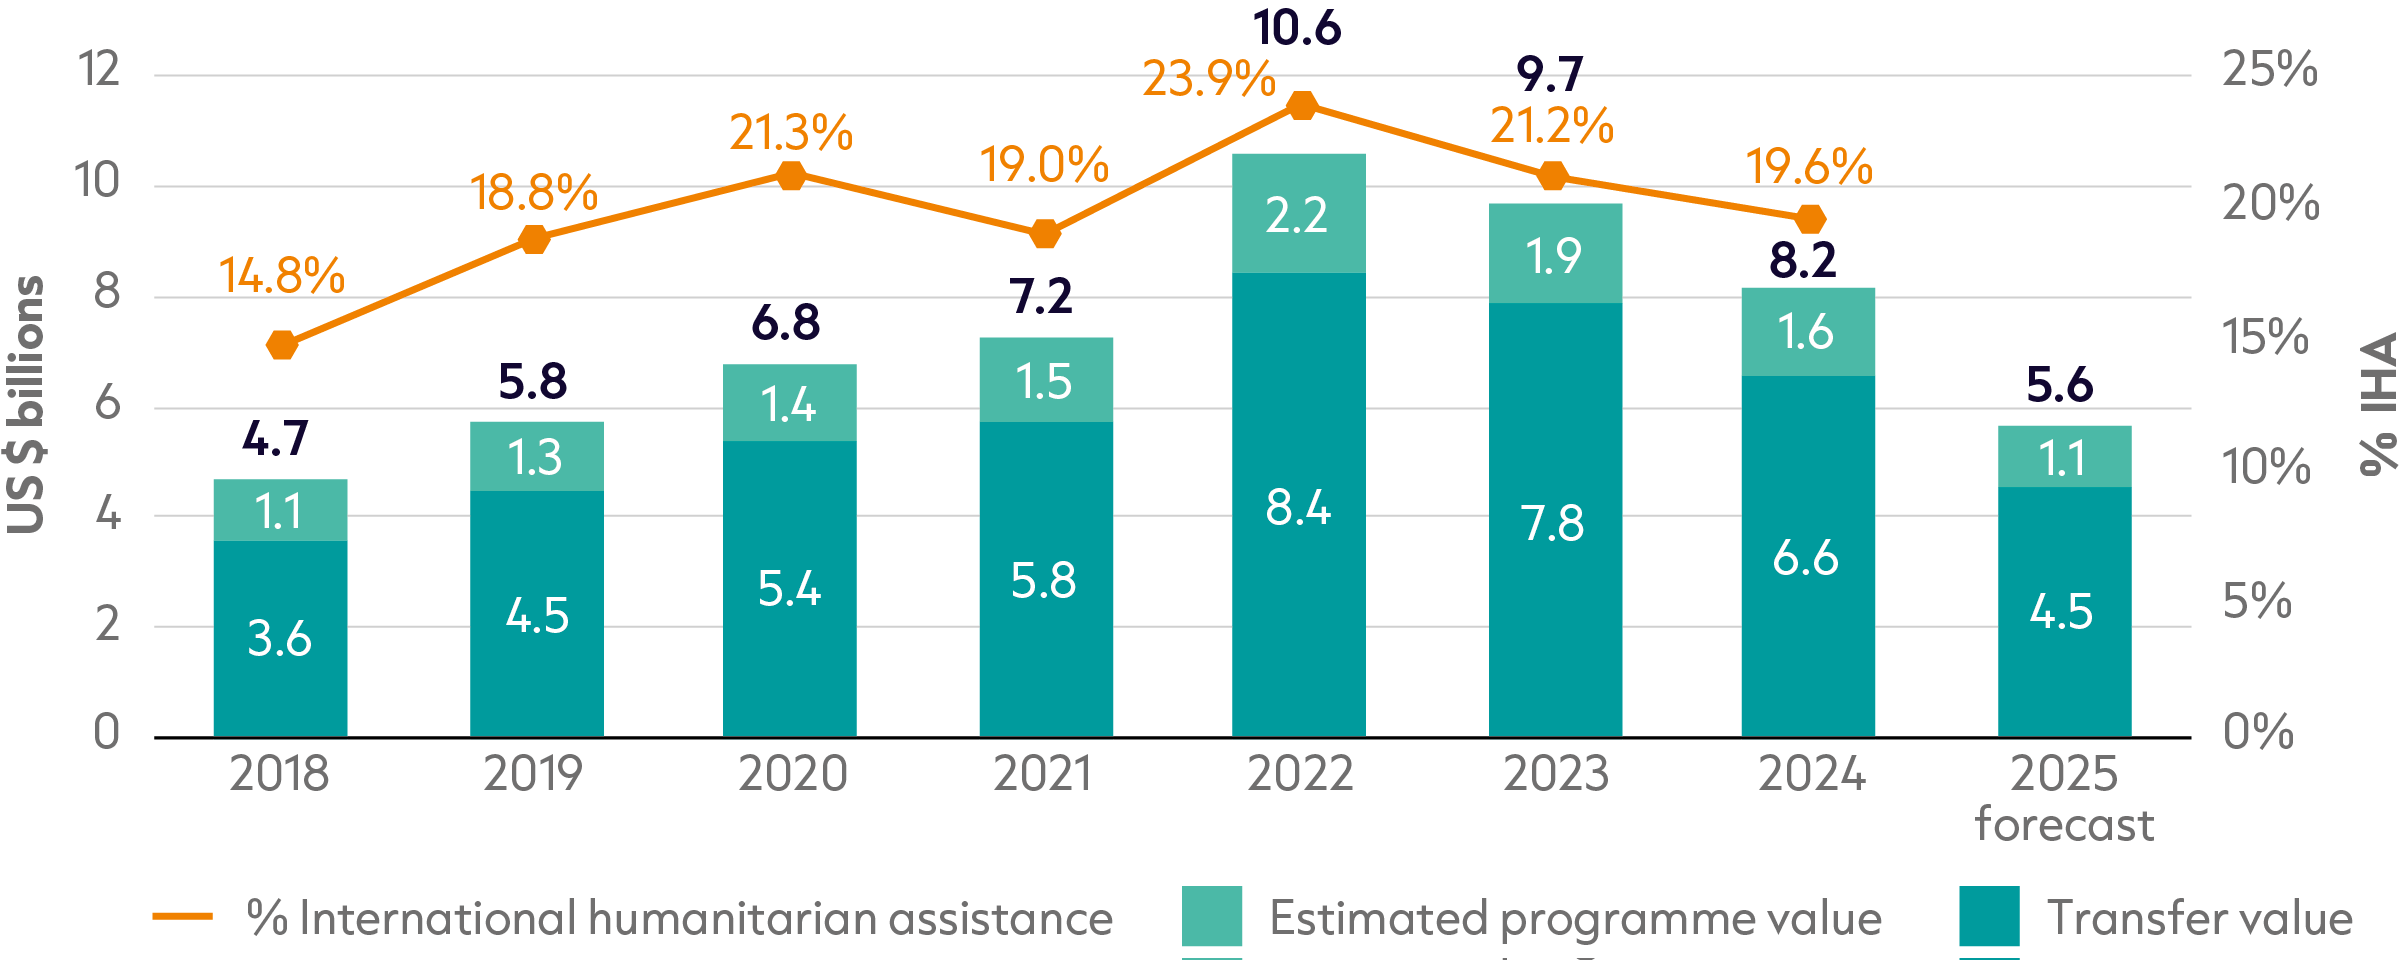
Source: Data on CVA volumes was collected by the CALP Network from implementing partners and supplemented with data from the UN OCHA FTS, HPC Projects Module and the Red Cross and Red Crescent Movement’s Cash Maps.
Notes: CVA volumes data for 2024 is initial as some organisations have not yet provided data or have provided partial data only. For a limited number of organisations that have consistently reported over the past eight years but weren’t able to submit in time this year, an estimate was used equivalent to 80% of their 2023 reported volume, based on an average decrease of 20% from 2023 to 2024 amongst reporting organisations. Double counting of CVA programmes that are sub-granted from one implementing partner to another is avoided where data on this is available. Transfer values for funding captured on FTS and HPC Projects are estimates based on the average ratio of transfer values to overall programming costs for organisations with available data. Data are not available for all included organisations across all years. Data is in current prices. Methodology for the forecasted estimates for 2025 can be found later in this section.
Figure 2.9: The proportion of CVA delivered by UN agencies and their implementing partners declined in 2024
Annual CVA volume distribution across organisation types, 2018–2024
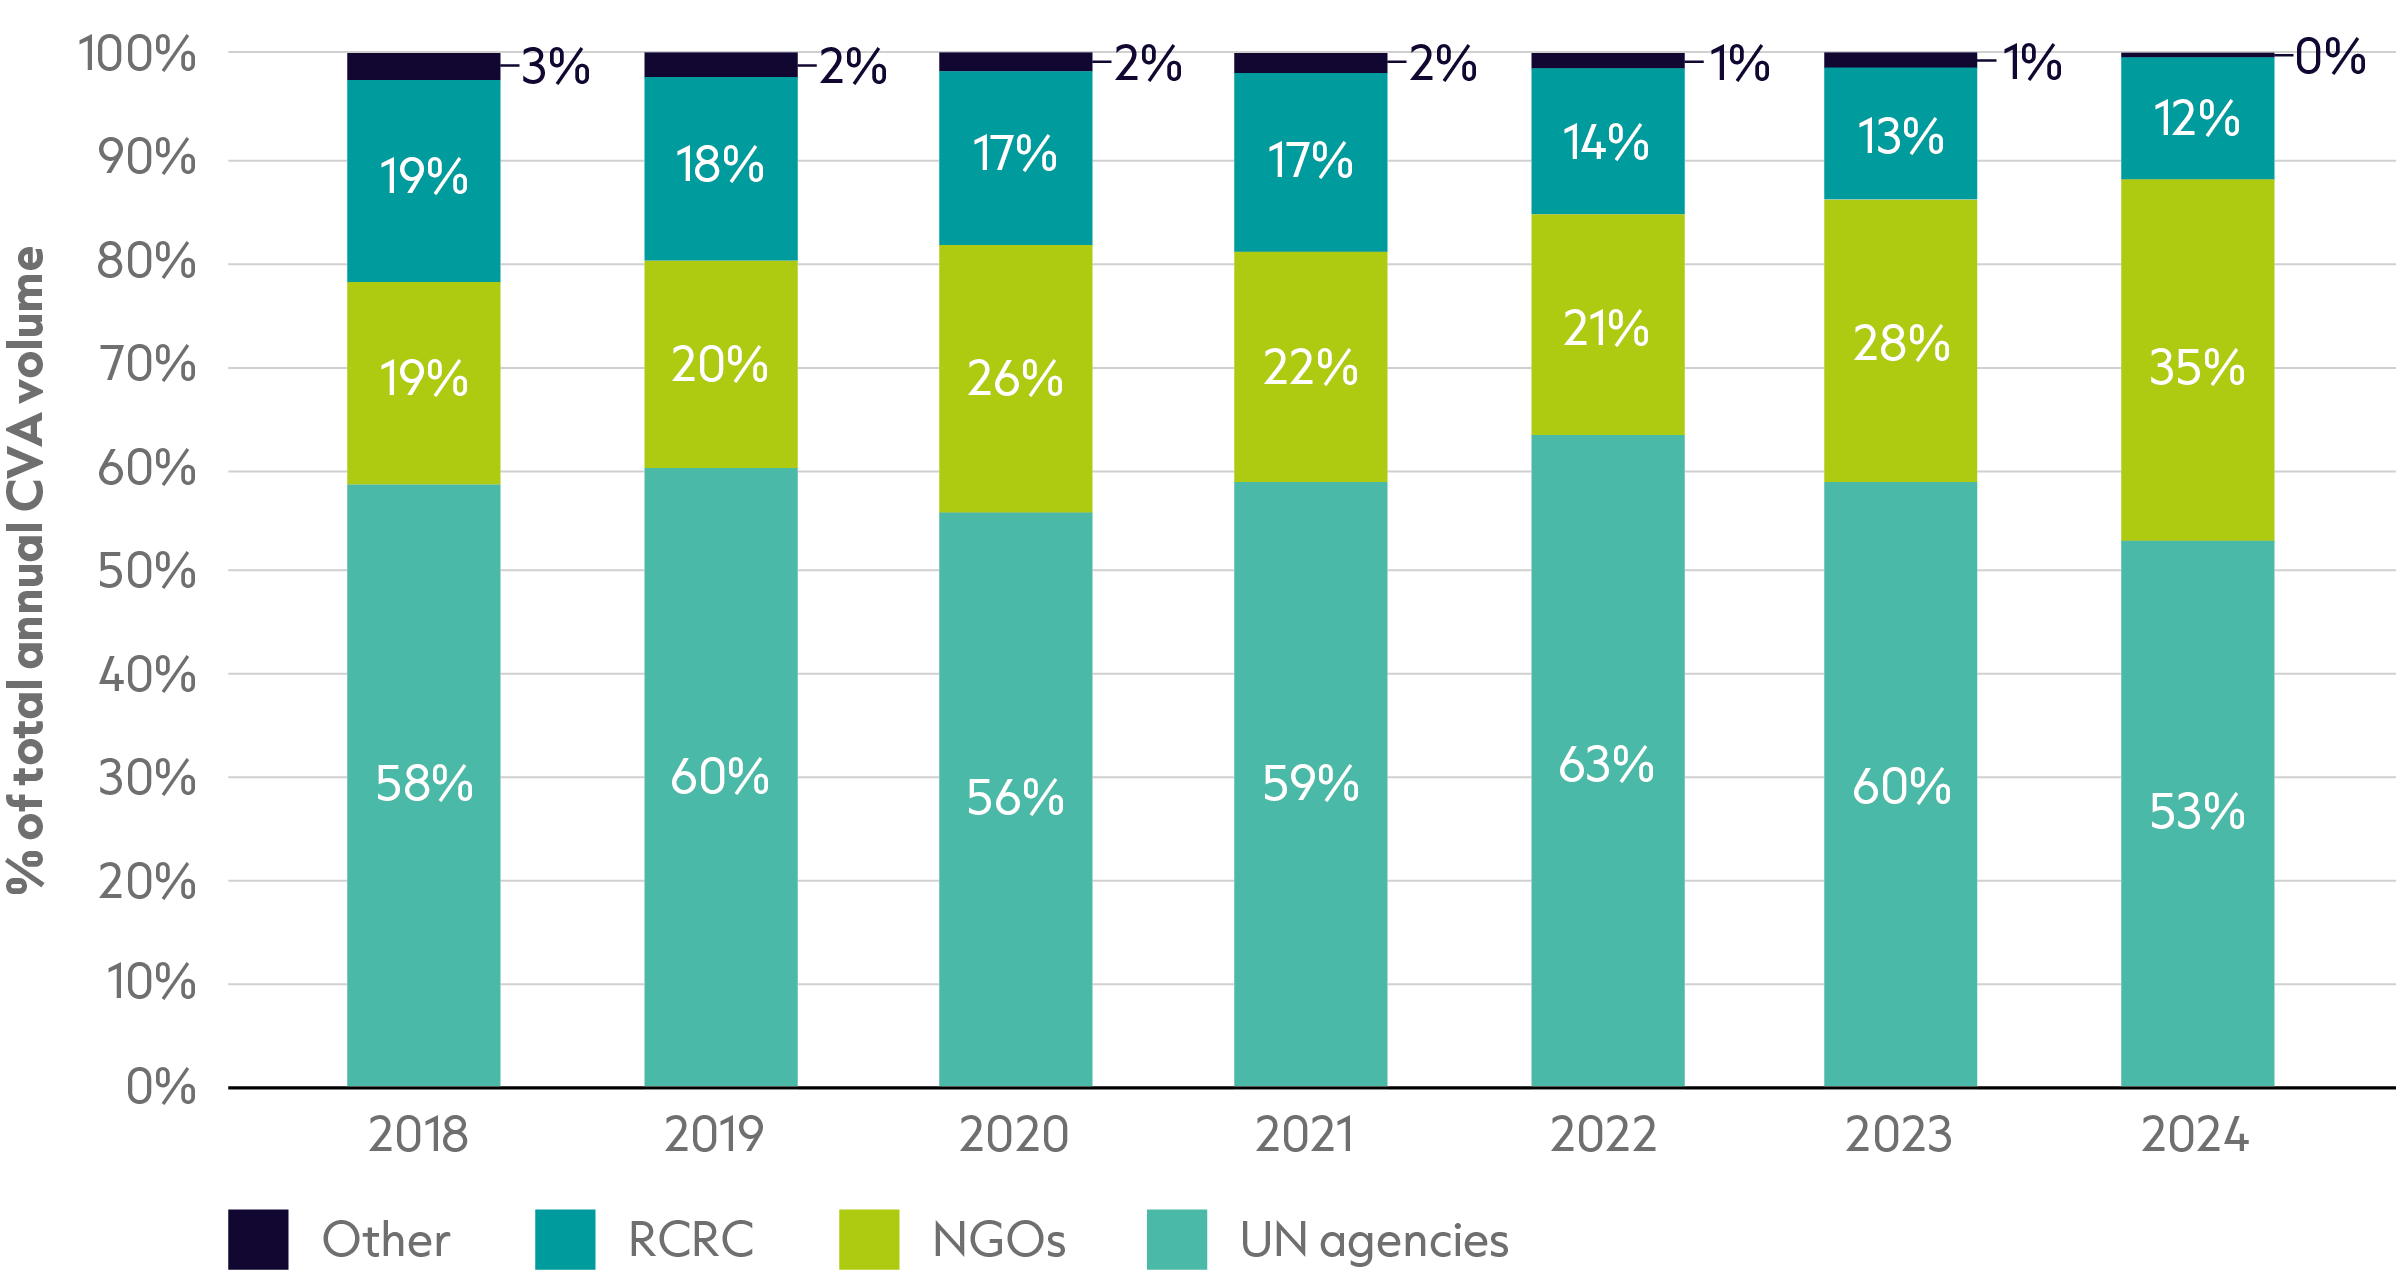
Source: Data on CVA volumes was collected by the CALP Network from implementing partners and supplemented with data from the UN OCHA FTS, HPC Projects Module and the Red Cross and Red Crescent Movement’s Cash Maps. RCRC = Red Cross and Red Crescent Movement.
Notes: Where possible and identifiable, this reflects the type of organisation that distributed the funds, such as an NGO receiving a sub-grant from an intermediary. However, not all organisations provided this level of detail in their reporting.
Footnotes
-
Center for Global Development (CGD), 2025. USAID Cuts: New Estimates at the Country Level. CGD blog, 26 March 2025. Available at: https://www.cgdev.org/blog/usaid-cuts-new-estimates-country-level
-
2025, NEAR. USG Funding Freeze. Available at: https://www.near.ngo/usgfundingfreeze
-
IASC, 2022. Caucus on the role of intermediaries - Final outcome document. Available at: https://interagencystandingcommittee.org/grand-bargain-official-website/caucus-role-intermediaries-final-outcome-document-august-2022
-
Denmark, Switzerland and UK, 2024. Guidance note for donors. Promoting inclusive and locally-led action through humanitarian pooled funds. Available at: https://interagencystandingcommittee.org/grand-bargain-official-website/guidance-note-donors-promoting-inclusive-and-locally-led-action-through-humanitarian-pooled-funds
-
UN OCHA, 2025. Briefing on the Humanitarian Landscape and Reset by Tom Fletcher, Under-Secretary-General for Humanitarian Affairs and Emergency Relief Coordinator, 15 May 2025. Available at: https://www.unocha.org/news/humanitarian-landscape-and-reset
-
Women’s Peace and Humanitarian Fund Dashboard. Available at: https://wphfund.org/wp-content/uploads/2025/04/WPHF_Dashboard- As-of-Apr-1-2025_FIN.pdf
-
Women’s Peace and Humanitarian Fund, 2024. Annual Report 2023. Available at: https://wphfund.org/annual-report-2023/
-
Start Network, 2024. Annual Report 2023. Available at: https://startnetwork.org/learn-change/resources/annual-reports/annual-report- 2023-digital
-
NEAR. NEAR’s Change Fund: Bridge Funding Window. Available at: https://www.near.ngo/the-change-fund-bridge-funding-window
-
IASC, 2025. Summary Note - Leveraging the Bargain – 28 March 2025. Available at: https://interagencystandingcommittee.org/grand-bargain-official-website/summary-note-leveraging-bargain-28-march-2025
-
UN OCHA, 2025. Briefing on the Humanitarian Landscape and Reset by Tom Fletcher, Under-Secretary-General for Humanitarian Affairs and Emergency Relief Coordinator, 15 May 2025. Available at: https://www.unocha.org/news/humanitarian-landscape-and-reset
-
Weingärtner L. and Spencer A., 2019. Analyzing gaps in the humanitarian aid and disaster risk financing landscape. Available at: www.anticipation-hub.org/download/file-153
-
FAO, OCHA and WFP, 2025. Saving lives, time and money: Evidence from anticipatory action. Available at: https://doi.org/10.4060/cd5250en
-
FAO, 2023. The Impact of Disasters on Agriculture and Food Security 2023: Avoiding and reducing losses through investment in resilience. Available at: https://doi.org/10.4060/cc7900en
-
Development Initiatives, 2024. Falling short? Humanitarian funding and reform. Available at: https://alnap.org/help-library/resources/global-humanitarian-assistance-report-2024
-
IASC, 2024. Outcome document. Commitments. Grand Bargain Caucus on Scaling Up Anticipatory Action. Available at: https://interagencystandingcommittee.org/sites/default/files/2024-12/GB%20AA%20-%20Final%20Caucus%20Outcome%20Document%20-%20New.pdf
-
In order to allow comparability between CVA volumes and total international humanitarian assistance figures, international humanitarian assistance in this analysis is in current prices. Therefore, the 9% drop in international humanitarian assistance here (current prices) is not comparable to that presented in Chapter 1 (11% drop), which is expressed in constant 2023 prices.
-
CVA volumes for 2018 and 2023 remain unchanged in this analysis from previous years, however the CVA as a share of international humanitarian assistance has been restated for this analysis. This data was previously reported in Development Initiatives (DI), 2024. Falling short? Humanitarian funding and reform. Available at: https://alnap.org/help-library/resources/global-humanitarian-assistance-report-2024/, in which CALP provided CVA volume data and DI researchers compiled international humanitarian assistance totals. For that report, the international humanitarian assistance figures used for the CVA comparison were based on a combination of UN OCHA’s FTS and OECD’s DAC data. For this analysis, ALNAP researchers revised the methodology to ensure consistency with international humanitarian assistance totals used elsewhere in this report. The reinterpretation primarily affects 2022 and 2023, as these years previously used FTS data for specific donors but are now based on DAC data, in line with the methodology used for other years. Minor differences also reflect retrospective updates made by funders to prior-year DAC submissions.
-
Percentages for cash and vouchers, respectively, are based on the subset of surveyed organisations that can provide disaggregated data; in recent years this includes the vast majority of reporting organisations.
-
UN OCHA, 2025. Cash and Voucher Assistance (CVA) - Ukraine 2024 Response Analysis Snapshot (January to December 2024). Available at: https://reliefweb.int/report/ukraine/cash-and-voucher-assistance-cva-ukraine-2024-response-analysis-snapshot-january-december-2024?_gl=1*1ngq4dl*_ga*MTUyMzIzMDE0OC4xNzQ2NzI4OTUw*_ga_E60ZNX2F68*czE3NDcxNDM2MjgkbzMkZzEkdDE3NDcxNDM4MzUkajYwJGwwJGgw
-
UN OCHA, 2025. Cash and Voucher Assistance (CVA) - Ukraine 2024 Response Analysis Snapshot (January to December 2024). Available at: https://reliefweb.int/report/ukraine/cash-and-voucher-assistance-cva-ukraine-2024-response-analysis-snapshot-january-december-2024?_gl=1*1ngq4dl*_ga*MTUyMzIzMDE0OC4xNzQ2NzI4OTUw*_ga_E60ZNX2F68*czE3NDcxNDM2MjgkbzMkZzEkdDE3NDcxNDM4MzUkajYwJGwwJGg
-
Calculations of the percentage distribution by organisation type is based on the organisations that report directly to CALP by completing the annual volumes survey.
-
CALP Network, 2025. US Funding Freeze – Estimating the impact on CVA volumes in humanitarian response. Available at: https://www.calpnetwork.org/web-read/us-funding-freeze-estimating-the-impact-on-cva-volumes-in-humanitarian-response/
-
In the survey conducted by CALP, agencies were asked to share their views ‘on the likely/predicted impact of funding cuts and other factors on your organisation's CVA volumes and programming in 2025?’. Responses were categorised into five groups: a significant decrease (around 40% or more), a moderate decrease (20–40%), a slight decrease (5–20%), no change or stable (0%), and unclear or too early to estimate. A weighted average was then created of n=18 responses to create an estimate of a 31% reduction, which was applied to the 2024 volume to calculate the projected 2025 figure.