The Humanitarian funding landscape
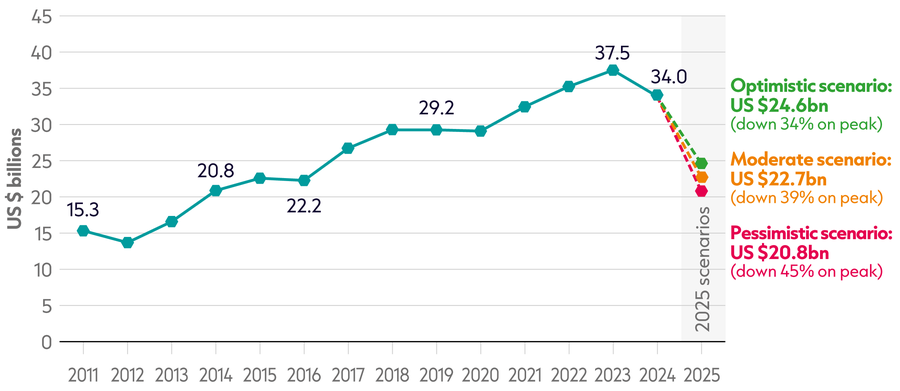
The humanitarian sector is at an inflection point. After years of unprecedented growth in funding, the sector is now in reverse gear. Total international humanitarian assistance declined by just under US $5 billion in 2024, the largest funding drop ever recorded. A range of scenarios produced for this report show that funding from public donors could drop between 34 and 45% in 2025 from their peak in 2023.
This is at a time when 305 million people are in need of humanitarian assistance globally.[1] Large-scale conflicts in Gaza, Sudan and Ukraine in recent years have put increasing pressure on the humanitarian system, whilst many of the protracted crises that have year-after-year interagency appeals risk being forgotten in an era of cuts.
This new era started before 2025, as data shows that the majority of donors started reducing humanitarian expenditure in 2024 (and some even before this). The ‘prioritisation’ exercise that started at the end of 2023 – which included reductions to the funding requirements of interagency coordinated appeals – is yet another sign that the turmoil currently facing the sector has been evident for a while.
Despite this, the current chaos in the humanitarian sector has felt sudden and is difficult to navigate. Individuals and organisations are discussing the impact of spending cuts on affected populations, whilst also trying to find the space to imagine a sector that is fit for the future. Aid agencies are stripping back services and having to lay off thousands of staff worldwide.
The story of this chapter is one of retreat. The year 2024 would have marked a watershed moment for the sector even before funding cuts by the US, which contributed 43% of public humanitarian assistance in 2024. Examining the trends that were already underway, even before the changes announced in 2025, can help to make sense of the future and provide a starting point for conversations about where the sector goes from here.
1.1: What was the trend in humanitarian financing leading into 2025?
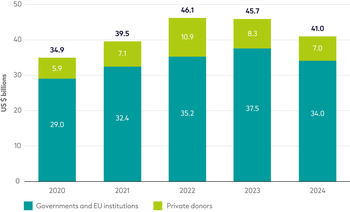
Figure 1.1: Humanitarian financing fell by 11% in 2024, before the cuts announced in 2025
Total international humanitarian assistance, 2020–2024
Source: ALNAP based on Organisation for Economic Co-operation and Development (OECD) Development Assistance Committee (DAC), UN Office for the Coordination of Humanitarian Affairs (OCHA) Financial Tracking Service (FTS), UN Central Emergency Response Fund (CERF) and our unique dataset for private contributions.
Notes: Figures for 2024 are preliminary. Totals for previous years differ from those reported in previous GHA reports due to updated deflators and data. Data is in constant 2023 prices. The methodology used to produce total international humanitarian assistance is detailed in the ‘Methodology and definitions’ chapter.
This figure was revised on 29 July 2025.
Total international humanitarian assistance declined in 2024 by just under US $5 billion, equating to 11% of funding to the sector. The decrease was due to reductions in both funding from public donors (governments and EU institutions) and private donors (such as foundations and the general public), with public donors making up the bulk of the overall drop. This followed a slight decline in overall international humanitarian assistance (IHA) in 2023, which was driven solely by a drop in private funding (public IHA increased slightly in 2023).
A drop of this magnitude comes after decades of long-term growth. The first ever Global Humanitarian Assistance (GHA) report in 2000 recorded overall humanitarian assistance of US $7.2 billion in 1998.[2] Just under 25 years later, the sector hit a peak in 2022 of over five times this value at US $46.1 billion.[3] Within this context, a decline of around US $5 billion is unprecedented for the sector.
Public funding for international humanitarian assistance fell sharply in 2024 after peaking in 2023. The decline in total international humanitarian assistance in 2024 is largely reflective of a widespread movement by public donors to cut humanitarian spending, with the majority of the top 20 donors cutting humanitarian expenditure in 2024 (see a donor breakdown in Figure 1.3):
- Funding from public donors fell from US $37.5 billion in 2023 to US $33.9 billion in 2024. This is the biggest ever fall in funding in absolute terms for public donors and the biggest percentage drop (-10%) since 2012 (when public donors gave 11% less compared to the year before).
- Public donor funding has returned to levels just above those of 2021, and not close to the amount received in 2022. This reflects the diminishing impact of the ‘Ukraine effect’, which significantly boosted humanitarian funding in 2022. A fall to around 2021 levels of public funding means that the gap between needs and funding is even wider than it was then, with the number of people in need rising by nearly 70 million people across 2021 to 2024.
- There were significant cuts from three large donors, the US, EU institutions and Germany, with other donors unable to step in to fill the gap – only three of the top 20 donors actually increased their budgets by over 5% in 2024.
At the same time, private funding remained an important part of funding for the sector and mirrors the trends seen in the public funding, with both notably exhibiting a waning ‘Ukraine effect’ post-2022:
- Private donors contributed an estimated US $7.0 billion in 2024, down from US $8.3 billion in 2023 (and down by over a third from the peak in 2022).
- Private funding peaked in 2022 when the escalation of the conflict in Ukraine appeared to drive greater appetite for contributions from private actors – but 2022 increasingly looks like an outlier.
- The contraction to US $7.0 billion in 2024 reflects a downward trend in the short term, but nevertheless it fits within the historical norm.
- Despite a decline, private funding remains an important source of funding for the international humanitarian sector, contributing 17% of total international humanitarian funding in 2024. This is also in line with the how much the sector received from private donors in 2020, 2021 and 2023, which was 17%, 18% and 18%, respectively.
This funding data confirms the reports throughout 2024 that organisations were already cutting back, including the International Committee of the Red Cross,[4] Save the Children,[5] the World Food Programme[6] and the International Rescue Committee.[7]
The situation was already deteriorating going into 2025 – the question now is: how much more constrained will funding become?
1.2: Which donors contributed the most in 2024?
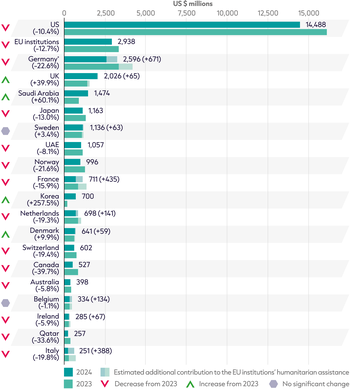
Figure 1.3: The majority of top donors cut humanitarian funding in 2024
20 largest public donors of humanitarian assistance in 2024, and change from 2023
Source: Based on OECD DAC, UN OCHA FTS and UN CERF.
Notes: 2024 data is preliminary. Data is in constant 2023 prices. ‘Public donors’ refers to governments and EU institutions. Contributions of current and former EU member states to EU institutions' international humanitarian assistance is shown separately. 2023 figures differ from the 2024 Falling short report[ede5e6] due to final reported international humanitarian assistance data and a different year for constant prices. † Numbers for Germany are calculated using preliminary data provided by the German Federal Foreign Office as well as OECD DAC, UN OCHA FTS and UN CERF. UAE = United Arab Emirates.
This figure was revised on 29 July 2025.
The majority of donors to international humanitarian assistance reduced their funding in 2024. Of the top 20 donors, 16 cut their humanitarian spending in 2024. This is a continuation of a trend in recent years:
- In 2022, 13 of the top 20 donors increased their contributions substantially (more than 5%), compared to 3 donors that decreased their contributions substantially. This split evolved in 2023 to only 9 of the top 20 donors upping contributions substantially versus 7 decreasing funding substantially. In 2024, this trend continued with only 3 of the top 20 donors increasing funding substantially compared to 15 decreasing funding substantially.
Of those that cut funding significantly in 2024, this included large reductions by some major humanitarian donors:
- The biggest reductions were by the US (–US $1.7 billion; –10%), Germany (–US $0.8 billion; –23%), EU institutions (–US $426 million; –13%), Canada (–US $347 million; –40%), Norway (–US $274 million; –22%) and France (–US $134 million; –16%).
- Reductions in funding from Germany and Canada continued a downward trend from both donors. Humanitarian spending peaked in 2022 for both, but funding in 2024 was around half of what it was only two years before for these two donors (Germany down 46% in two years; Canada down 53% in two years). However, an increase is expected for Canada in 2025 due to the phasing of 2024/25 financial year disbursements occurring in the 2025 calendar year.
- Decreases in funding from Japan and Norway represent a decline on a historic peak in 2023, but funding is still above 2022 levels and Norway has budgeted for an increase in the 2025 ODA and humanitarian budgets (see Figure 3.1).[14]
- Only a handful of donors increased their funding in 2024, albeit with large increases from some donors.
- The largest increases in international humanitarian assistance are from: Saudi Arabia (+US $553 million; +60%), the UK (+US $578 million; +40%), and Korea (+US $504 million; +257%).
Despite reductions in funding from the largest donors, the shape of the funding landscape was largely similar in 2024 to previous years. The top three donors gave 59% of all public donor funding (similar to 61% in 2023), whilst the top 10 donors gave 84% of all public donor funding (similar to 83% in 2023).
Another perspective to analyse donor contributions is by comparing it to donor countries’ national economic capacity. A voluntary target of 0.07% of Gross National Income (GNI) was established in 2023 by the EU for its member states, but few countries meet this benchmark. When including multilateral contributions, 9 DAC countries met the threshold in 2024: Luxembourg (0.22%), Sweden (0.19%), Norway (0.19%), Denmark (0.13%), Ireland, (0.08%), Netherlands (0.07%), Belgium (0.07%), Iceland (0.07%), and Germany (0.07%). However, with further funding reductions coming from a number of donors, it is hard to see more reaching this benchmark in the near future.
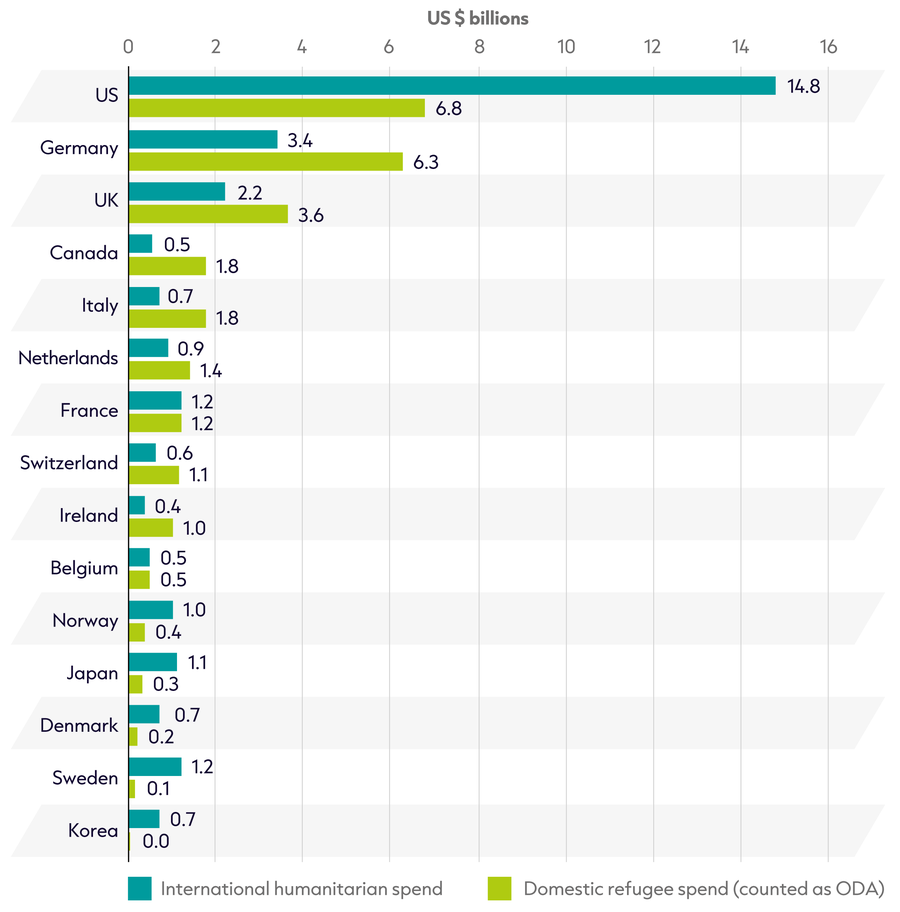
The growing trend towards cutting humanitarian budgets, as illustrated by how many donors were already reducing spending in 2024, is accelerating in 2025. This includes cuts announced by some of the major European powers, such as Germany, the UK and France, which are grappling with the politics of international aid at a time when there is pressure to increase defence spending (for more on specific donor cuts see Chapter 3).
1.3: Which countries were the largest recipients in 2024?
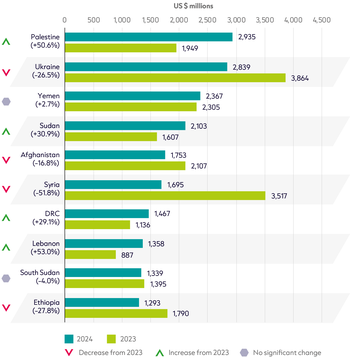
Figure 1.5: Palestine was the largest recipient of humanitarian assistance in 2024
10 largest recipient countries of international humanitarian assistance
Source: Based on UN OCHA FTS.
Notes: Values in constant 2023 prices. DRC = Democratic Republic of the Congo.
The sustained acute humanitarian crisis in Gaza has seen funding to Palestine almost triple since 2022. Donors provided an additional US $1 billion to Palestine in 2024, which overtook Ukraine and Syria as the largest recipient of international humanitarian assistance.
More broadly, while there has been a significant refocusing of allocations, the makeup of the 10 largest recipients of humanitarian funding has changed very little in 2024. The same crises are absorbing the majority of humanitarian assistance, with overall funding remaining heavily concentrated in protracted crises.
- Palestine was the largest recipient of international humanitarian assistance in 2024, receiving US $2.9 billion, an increase of 51%. This followed an increase of 88% in 2023.
- Funding for Ukraine has continued to taper – from US $3.9 billion to US $2.8 billion – falling by a quarter for the second year in a row after its peak in 2022.
- Funding to Syria has also significantly fallen; it received less than half of the funding it received in 2023, from US $3.5 billion to US $1.7 billion in 2024.
- At the same time, a resurgence of violence drove notable increases in funding to Lebanon (+53%), Sudan (+31%) and Democratic Republic of the Congo (+29%).
Beyond these funding reallocations, the makeup of recipients has not changed in 2024 and all of them are facing protracted crises. Eight of the 10 largest recipients of funding in 2024 were also present in the top 10 of 2023 (see more on protracted crises in Chapter 4).
- Funding remains concentrated among a small number of recipients. In 2024, the top five countries received 41% of country-allocable international humanitarian assistance, the same percentage as 2023.
- The vast majority of international humanitarian assistance continues to be provided to countries experiencing protracted crisis – in 2024, 94% of country-allocable humanitarian funding was provided to protracted crises, an increase from 2023 (89%) and 2022 (84%).
With funding set to decline in 2025, it is likely that donors will need to further prioritise their allocations, potentially leading to an even greater concentration of funding to a small number of countries.
1.4: Was humanitarian funding sufficient?
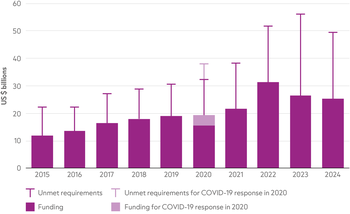
Figure 1.6: Prioritisation means humanitarian requirements fell but the funding gap remains the second highest on record
Funding and unmet requirements, UN-coordinated appeals, 2015–2024
Source: Based on UN OCHA FTS, Syria Regional Refugee and Resilience Plan (3RP) dashboards and UN High Commissioner for Refugees (UNHCR) Refugee Funding Tracker
Notes: Data is in current prices. The percentage of requirements met in 2020 includes all funding, for COVID-19 and other responses, against all requirements that year. GHRP = Global Humanitarian Response Plan.
Funding requirements for UN-coordinated appeals have significantly increased over the past decade, reaching a peak of US $56.1 billion in 2023. With a record-breaking funding gap of US $29.7 billion, 2023 felt like a tipping point for the sector. In an attempt to address the growing gulf between the funding requested and the funding provided, the interagency appeals process underwent a prioritisation exercise in 2023 for the following year.
The aim of this exercise was to narrow the focus of humanitarian response plans to core lifesaving needs to reflect more realistic funding availability, while at the same time attempting to draw clearer boundaries around what falls under a humanitarian mandate and what is the responsibility of development agencies.
As a result, overall funding requirements fell for the first time since 2014 (excluding the year after the COVID-19 Global Humanitarian Response Plan) as both the number of people identified as being in need fell and the proportion of those targeted through the plans fell to the lowest ever proportion. The Global Humanitarian Overview noted that while this was due to some improvements in humanitarian contexts, it was also due to a more ‘nuanced’ methodological approach.[17]
However this substantial reduction in requirements has done little to improve the overall funding situation in 2024, and the funding gap remained the second largest on record.
Appeal requirements decreased by 12% in 2024 to US $49.5 billion.
- Despite this drop, only 51% of requirements were met. In 2024, appeal funding totalled US $25.3 billion, slightly less than 2023 (US $26.3 billion).
- As a result, the gap between requirements and funding in 2024 was US $24.2 billion, less than for 2023 (US $29.7 billion) but still the second highest funding gap on record.
- Funding to individual plans varies wildly with escalations of ongoing protracted crises experiencing higher growth in appeals than other crises, as the system prioritises fast-breaking emergencies. For example, Palestine was up by 51% and Sudan by 31% in 2024, whilst the average across the rest of the top 20 recipients of humanitarian assistance was a decrease of 3%.
- Other than the Ukraine Humanitarian Response Plan, the plans with the highest proportion of funding requirements met were all flash appeals (Libya, Lebanon, Palestine and Madagascar) or appeals for sudden-onset emergencies (Nepal and Burundi).
The appeals were modified further in a prioritisation exercise in spring 2025, as sector-wide funding cuts from key donors increased pressure on an already-overloaded system. Requirements to date for 2025 show that humanitarian response plans continue to be squeezed, so far totalling US $46.2 billion, despite the number of people in need rising.
A further subset of the overall funding requirement is expected with country coordination teams asked to further prioritise their funding requirements into a ‘re-prioritised’ funding requirement. As of early June 2025, the average (median) response plan has cut their funding requirement by 41%, however there is a large variation between plans. Plans that have cut their funding requirement the most include Somalia (-74%), Nigeria (-67%) and Burkina Faso (-65%), whilst Haiti (-17%), Myanmar (-32%) and Cameroon (-32%) have cut their funding requirement the least.
It is unclear whether there is a consistent methodology behind the reprioritisation. Published documents point towards the prioritisation being “driven by financial constraints rather than updated needs assessments”[18], and responses being focused on "implementing critical life-saving activities"[19]. However, these documents point towards different severity levels being used for the reprioritisation exercise in different contexts, whilst the strategic objectives in scope are not consistently clear across reprioritised plans.
However, the messaging is clear – humanitarian actors are focusing on ‘time-limited, disaster-driven’ responses and attempting to pull back from high levels of sustained support for protracted crises, while ramping up efforts to improve cost efficiency and effectiveness.[20]
With the full impact of cuts from the US and other donors not yet known, it is uncertain whether this approach will actually lead to a smaller funding gap, and the extent to which this will conceal the true reality of humanitarian need as more people are no longer targeted by response plans. Meanwhile, the implications for future appeal planning processes remains unclear.
Footnotes
-
UN OCHA. 2024. Global Humanitarian Overview 2025. Available at: https://www.unocha.org/publications/report/world/global-humanitarian-overview-2025-enarfres
-
Development Initiatives, 2000. Global Humanitarian Assistance 2000. Available at: https://alnap.org/help-library/resources/global-humanitarian-assistance-2000/
-
Using data from the Global Humanitarian Assistance 2000 report produced by Development Initiatives, total international humanitarian funding volumes were converted into 2023 prices using figures presented in Table A1 and A6. Deflators from the OECD were used for to convert the figures into 2023 prices. The Global Humanitarian Assistance 2000 report is available at: https://alnap.org/help-library/resources/global-humanitarian-assistance-2000/
-
The Straits Times, 2023. Red Cross cuts 2024 budget by 13%, to lay off 270 workers as donations fall. 11 September 2023. Available at: https:// www.straitstimes.com/world/europe/red-cross-cuts-2024-budget-voices-concern-about-humanitarian-impact
-
Goldberg J., 2024. Save the Children to cut hundreds of jobs as funding gap looms. The New Humanitarian, 12 August 2024. Available at: https://www.thenewhumanitarian.org/news/2024/08/12/exclusive-save-children-cut-hundreds-jobs-funding-gap-looms
-
Simon S., 2024. As global hunger crises worsen, the UN's World Food Programme faces a funding shortage. NPR, 9 March 2024. Available at: https://www.npr.org/2024/03/09/1237179277/as-global-hunger-crises-worsen-the-uns-world-food-programme-faces-a-funding-shor
-
Loy I., 2024. IRC cuts staff amid budget shortfall. The New Humanitarian, 7 August 2024.
-
Inman P., 2025. What have three years of Putin’s war done to both nations’ economies? The Guardian, 22 February 2025. Available at: https:// www.theguardian.com/world/2025/feb/22/what-have-three-years-of-putins-war-done-to-both-nations-economies
-
Office for National Statistics, 2021. GDP and events in history: how the COVID-19 pandemic shocked the UK economy. Data and analysis from Census 2021. Available at: https://www.ons.gov.uk/economy/grossdomesticproductgdp/articles/ gdpandeventsinhistoryhowthecovid19pandemicshockedtheukeconomy/2022-05-24
-
Okiror S., 2025. Trump’s aid cuts blamed as food rations stopped for a million refugees in Uganda. The Guardian, 8 May 2025. Available at: https://www.theguardian.com/global-development/2025/may/08/trump-aid-cuts-halts-food-supplies-million-refugees-uganda-repatriation-fears-un
-
Al Jazeera, 2025. South Sudanese children die as US aid cuts shutter medical services: NGO. 9 April 2025. Available at: https://www. aljazeera.com/news/2025/4/9/us-aid-cuts-leave-south-sudan-children-dead-as-medical-services-collapse
-
Norwegian Refugee Council, 2025. Afghanistan: Crippling aid cuts threaten lives and wellbeing of the most vulnerable. 25 March 2025. Available at: https://www.nrc.no/news/2025/march/afghanistan-crippling-aid-cuts-threaten-lives-and-wellbeing-of-the-most-vulnerable
-
Ahmed K., 2025. Refugees in Kenya’s Kakuma camp clash with police after food supplies cut. The Guardian, 5 March 2025. Available at: https://www.theguardian.com/global-development/2025/mar/05/refugees-clashes-police-kakuma-camp-kenya-protests-cuts-wfp-unhcr-food-aid-us-freeze
-
Donor Tracker, 2025. Donor Profile: Norway. Available at: https://donortracker.org/donor_profiles/norway#budget
-
OECD, 2025. Sweden: In-donor refugee costs in ODA. Available at: https://www.oecd.org/content/dam/oecd/en/topics/policy-issue-focus/ in-donor-refugee-costs-in-oda/oda-in-donor-refugee-costs-sweden_update-2025.pdf
-
OECD, 2025. In-donor refugee costs in official development assistance (ODA). Available at: https://www.oecd.org/en/topics/sub-issues/oda-eligibility-and-conditions/in-donor-refugee-costs-in-official-development-assistance-oda.html
-
UN OCHA, 2023. Global Humanitarian Overview 2024. Available at : https://www.unocha.org/publications/report/world/global-humanitarian-overview-2024-enarfres
-
UN OCHA. 2025. At a glance | Re-prioritized HNRP, Sudan. Available at: https://content.hpc.tools/sites/default/files/2025-04/SDN_ HNRP_2025_At_a_glance_prioritized_page-0001.jpg
-
UN OCHA. 2025. At a glance | Re-prioritized HNRP, Myanmar. Available at: https://content.hpc.tools/sites/default/files/2025-05/ Myanmar%202025%20HNRP%20Prioritized%20%20Earthquake%20Addendum%20-%20At%20A%20Glance%20-%20April%20 2025-3%20%281%29_page-0001.jpg
-
Global Humanitarian Overview, 2025. Available at: https://humanitarianaction.info/document/global-humanitarian-overview-2025/article/ humanitarians-response-urgent-appeal-access-and-funding#page-title
