Crisis context amidst the cuts
2.1: Summary
2.2: How has humanitarian funding changed to the largest recipient contexts?
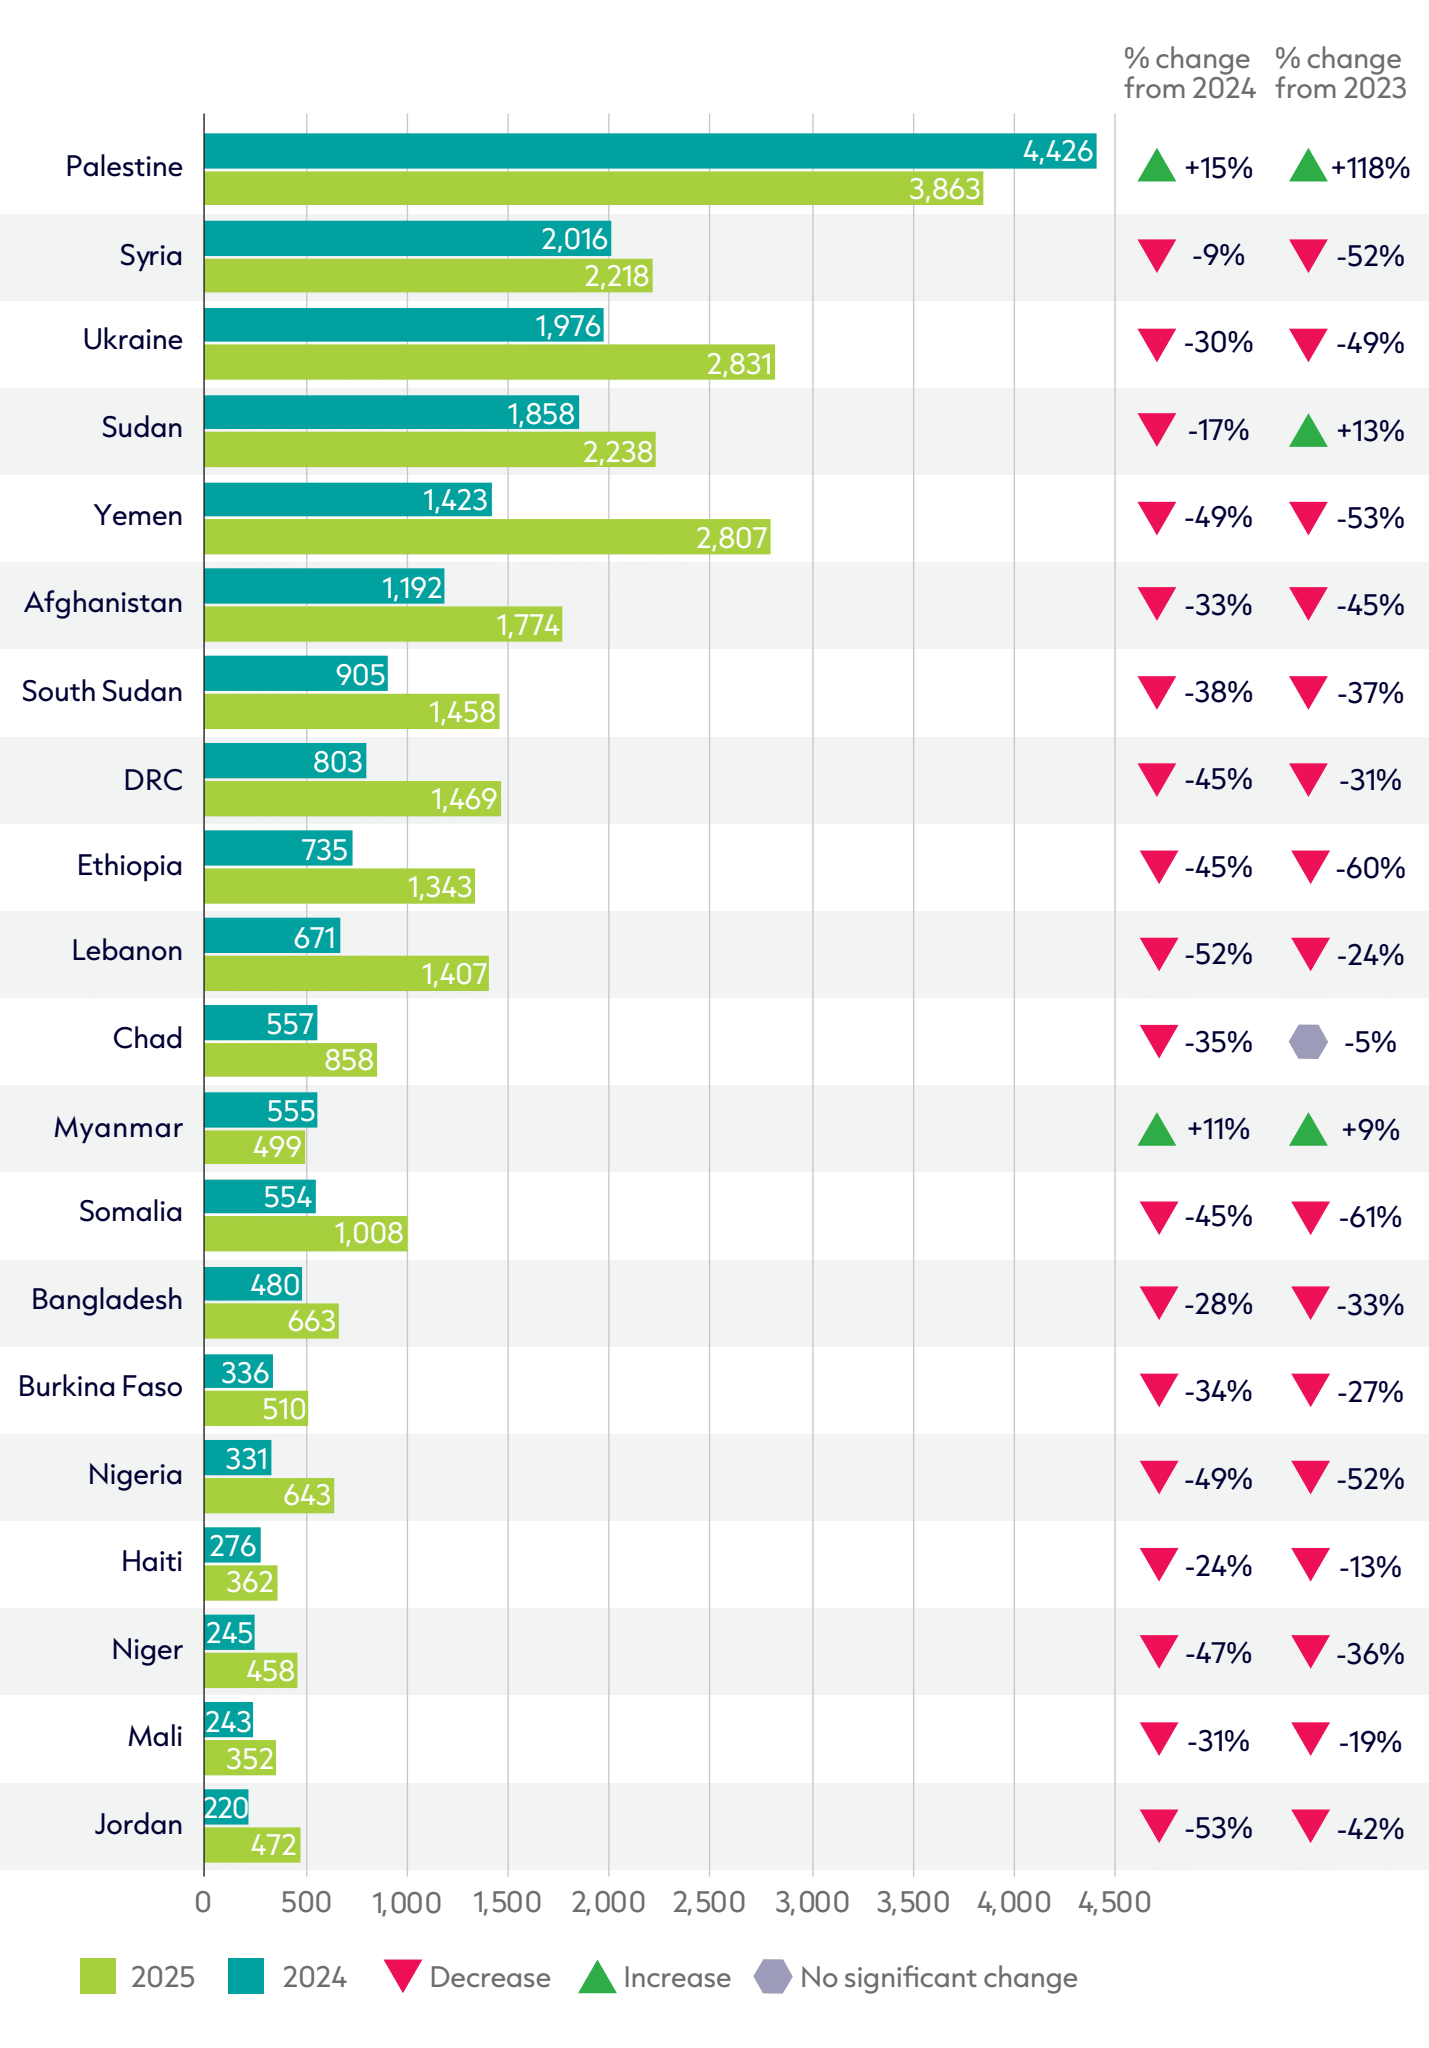
Figure 2.1: Almost all of the largest recipient countries of humanitarian assistance experienced funding cuts in 2025
Recipient countries of international humanitarian assistance, 2023–2025
Source: Based on UN Office for the Coordination of Humanitarian Affairs (OCHA) Financial Tracking Service (FTS) data.
Notes: Data is in constant 2024 prices. Totals for previous years differ from those reported in previous GHA reports due to deflation and updated data. DRC = Democratic Republic of Congo.
Significant reductions in humanitarian assistance in 2025 meant funding fell for 18 of the 20 largest recipient countries. Despite these reductions, the makeup of the top 20 recipient countries remained fairly constant. In fact, 18 out of the top 20 recipients in 2025 were also in the top 20 list in 2024 and the countries in the top 10 list remained unchanged across the two years.
Funding increased to only two of the 20 largest recipients in 2025 – Myanmar and Palestine:
- Myanmar saw a funding increase of 11% to US $555 million in 2025, following a fall in 2024 of 2%.
- Palestine was the only context where humanitarian assistance increased in both years since 2023, against a backdrop of falling international humanitarian assistance. As the humanitarian catastrophe in Gaza continued, Palestine was the largest recipient of humanitarian assistsance in 2025 – receiving US $4.4 billion, an increase of US $562 million (a 15% rise) compared to 2024. This followed an increase of 90% in 2024 and 91% in 2023, meaning humanitarian assistance to Palestine in 2025 was quadruple that of 2022.
However, funding to the vast majority of contexts declined in 2024. These decreases compound declines experienced in the previous year: since the peak of public donor funding in 2023, funding has fallen significantly to 16 of the top 20 recipient countries:
- Syria – the largest recipient of humanitarian assistance in 2023 – has seen consecutive falls in funding: a 47% fall in 2024 and a 9% fall in 2025. As a result, funding has fallen to less than half its peak (at US $2.0 billion in 2025 from US $4.2 billion in 2023). This is despite the fact that the number of people in need has stayed stable at around 16.5 million people since 2024.[2]
- Ukraine was the top recipient in 2022. However, funding volumes fell significantly for the third consecutive year: by 30% in 2025 to US $2.0 billion, down from US $2.8 billion in 2024. This follows falls of 27% in 2023 and 28% in 2024. As a result, funding in 2025 is 63% below the peak in 2022.
Many countries facing protracted crises were hit very hard by humanitarian funding cuts in the past two years:
- Two countries in the top 20 faced humanitarian funding reductions of over half in 2025 compared to 2024: funding fell by 53% to Jordan (down to US $220 million), and by 52% to Lebanon (down to US $671 million).
- Six countries saw funding reduced by over 40% in 2025, all of which were protracted crisis contexts: Yemen (–49%), Nigeria (–49%), Niger (–47%), Somalia (–45%), Democratic Republic of the Congo (DRC) (–45%) and Ethiopia (–45%).
- Five of the top 20 recipient countries faced funding reductions by over half in the past two years, including Somalia (–61%), Ethiopia (–60%), Yemen (–53%), Syria (–52%) and Nigeria (–52%).
Humanitarian assistance became even more heavily concentrated amonst a few recipient countries; the top five contexts in 2025 received 51% of all humaniarian funding allocated to specific countries, while the top 10 received 70%. This compares to 43% and 66%, respectively, in 2024. This reflects a growing trend of prioritsation in the humanitarian system, as increasingly limited resources have been allocated to a narrower pool of contexts. Unprecedented cuts in 2025 resulted in even further prioritisation (hyper-prioritisation), with funding becoming even more concentrated as a result.
2.3: How have funding cuts impacted donor concentration?
As some of the largest humanitarian donors cut funding in 2025, not only did volumes of funding to recipient countries fall but the financial influence amonst top donors shifted and reduced. In many contexts, the US dominance as the top donor weakened sharply in 2025, with EU institutions and Gulf states gaining more of the donor share in some contexts. This has implications for the power of donors to drive how responses are organised and how funding is allocated.
For 19 of the 20 top recipient countries, the combined share of funding from the three historically largest donors for each country fell in 2025 compared with 2024:
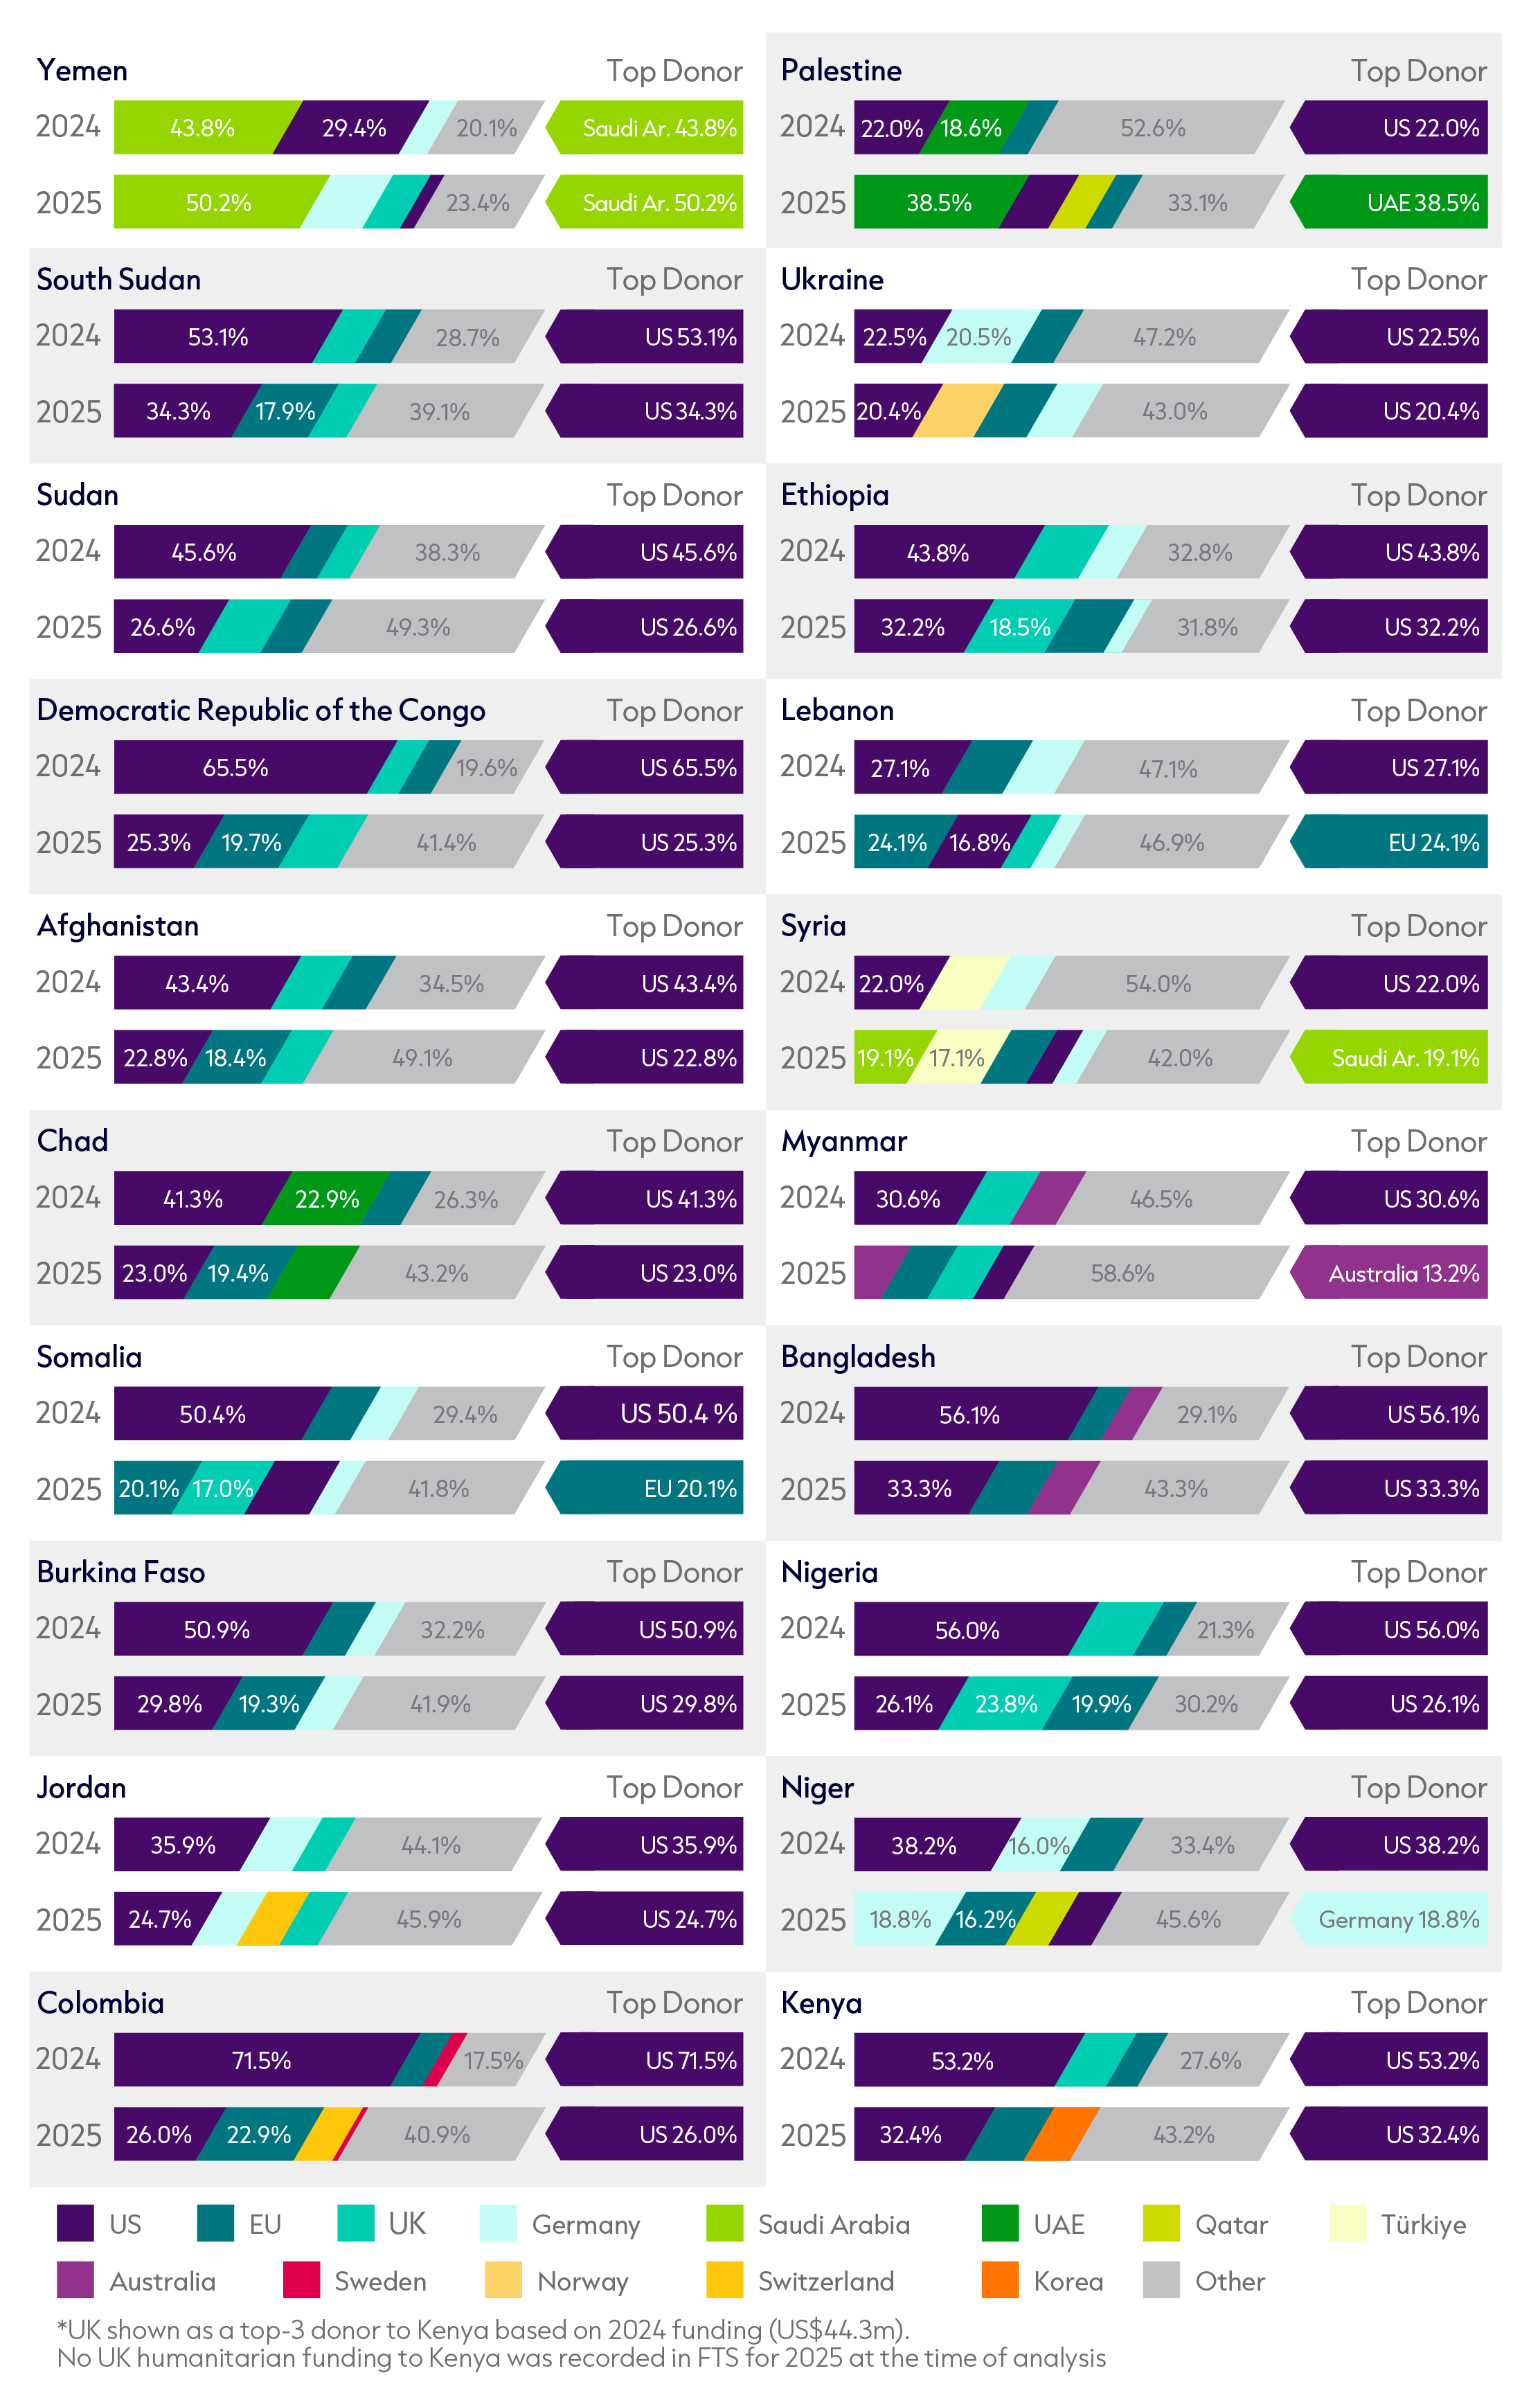
- The largest reductions were seen in Colombia (a 32.5 percentage point fall, from approximately 82% to 50%), Somalia (–29.4 percentage points, from approximately 71% to 41%), Kenya (–26 percentage points, from 72% to 46%), Myanmar (–23 percentage points), Niger (–22 percentage points), and DRC (–22 percentage points).
- The largest donor changed in six out of the top 20 contexts in 2025. Given the cuts to US funding globally, the US was overtaken as top donor by EU institutions in Lebanon and Somalia, by Australia in Myanmar, by Germany in Niger, by Saudi Arabia in Syria, and by the United Arab Emirates (UAE) in Palestine.
- While the US retained position as top donor in 13 contexts in 2025, its share fell in every one of these compared to 2024, a year when the US was lead donor in 19 out of 20 contexts.
Figure 2.2: Funding cuts from major donors have driven a reduc
Changes in donor concentration across top 20 contexts, 2024–2025
Source: Based on UN OCHA FTS.
Notes: Data is in constant 2024 prices. For each context, the figure shows the share of country-level humanitarian funding provided by its three historically largest donors across both years, as well as any other donors who were in the top three in 2025, and an ‘other’ category covering all remaining donors. The top 20 countries listed do not match exactly with those in Figure 2.1. This is due to methodological differences in analyses taking a ‘donor perspective’ for Figure 2.2 and a ‘recipient perspective’ for Figure 2.1. DRC = Democratic Republic of the Congo; UAE = United Arab Emirates.
Reductions in US funding meant that EU institutions replaced the US as the top donor in two contexts but also increased its share of country-level funding in 18 of the 20 contexts, including 13 contexts with a substantial increase in share (plus five percentage points). Even where increases from the EU institutions were significant, they were dwarfed by US cuts.
- For example, funding from EU institutions to DRC increased by 32% (US $33 million) from 2024 to 2025, but the collapse of US funding by 81% (–US $732 million) was the main driver of the increased EU institutions’ share of total funding, which rose from 7% to 20%.
- In Ethiopia, Kenya, Lebanon, Niger, Somalia, Ukraine and Yemen, US funding cuts led to an increase in the EU institutions’ share of total funding, despite a decline in EU institutions’ funding volumes.
Gulf donors are increasingly visible in the top donor mix in conflict-affected Middle East and North Africa contexts, driven by both funding increases and collapsing US funding:
- In Palestine, funding from the UAE increased by 142% (from US $683 million to US $1.6 billion), making it the largest donor by far.
- Qatar’s share of funding to Palestine also increased to 9% as funding rose over five-fold (US $62 million to US $376 million).
- Saudi Arabia overtook the US as lead donor in Syria, increasing funding 155% (+ US $258 million), while US funding fell 75% (–US $327 million). Saudi Arabia also retained lead donor position in Yemen with the share of funding rising from 44% to 51%. This was despite a 43% fall in its funding, because US funding concurrently declined more sharply.
The changing donor landscape also means that the position of ‘blocs’ of donors is changing, with the EU as a bloc (EU institutions and EU member states) having increasing power, and to a lesser extent Gulf donors:
- In 2024, the combined share of the EU bloc was larger than the US share in only five of the current top 20 contexts. However, in 2025, the EU bloc outstripped US funding and share in 18 of the top 20 contexts. This increases to 19 contexts when including Switzerland.
- On average, the EU bloc now represents 35% of funding in the top 20 contexts, compared with 23% in 2024.
- Gulf donors also give more funding than the US in four contexts in 2025 (up from two in 2024), namely: Niger, Palestine, Syria and Yemen.
Donor concentration increased in only two contexts. In Syria, the share of funding from the top three donors increased by one percentage point (46% to 47%), whilst in Palestine the funding share from the top three donors rose by 14 percentage points (47% to 61%), driven by UAE’s expanded contribution.
Changes in donor concentration in different contexts affects who has power within the humanitarian architecture. This affects who gets funded, what gets funded, the priorities of the humanitarian system, and how funding is chanelled (e.g. through the UN or national governments). However, whether donors choose to use the power implicitly (through internal decision making) or explicitly (through prompting broader conversations in the sector) likely varies from donor to donor and context to context. As the donor landscape continues to change, so will the centres of gravity within the humanitarian system.
2.4: Are UN appeals sufficiently funded and where do they focus?
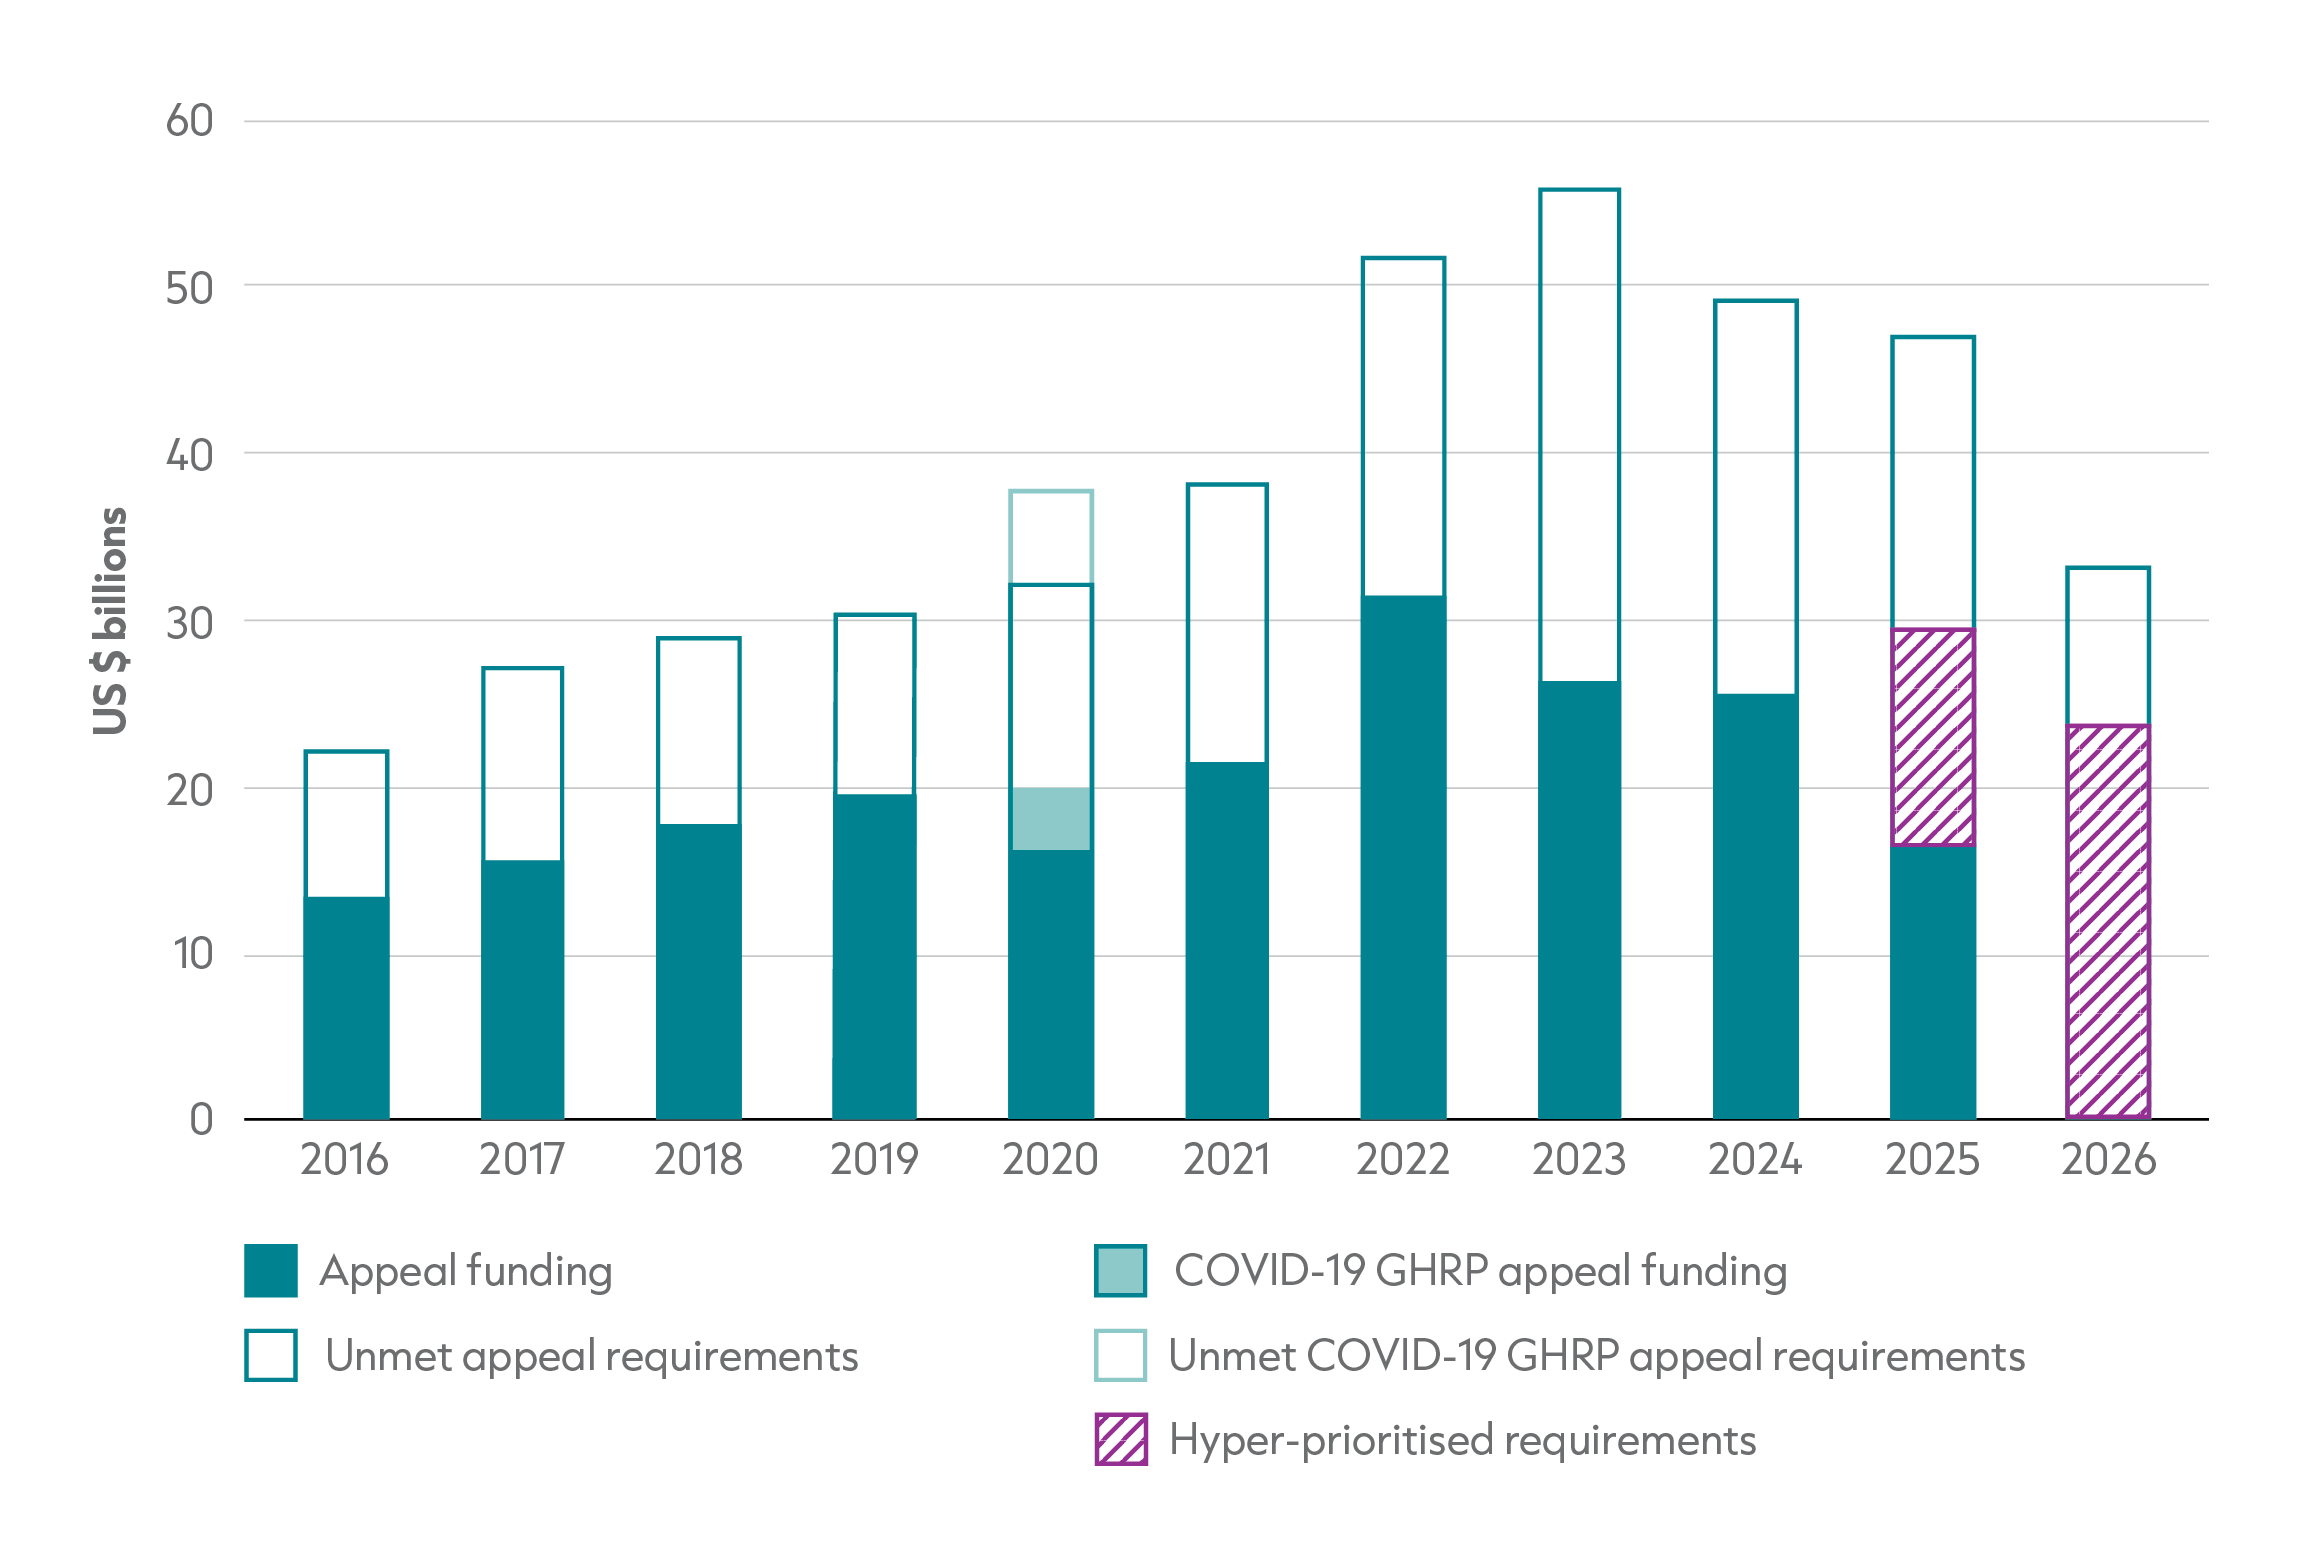
Figure 2.3: Prioritised funding requirements in 2026 are less than half of funding requirements in 2022
Funding and unmet requirements, UN-coordinated appeals, 2016–2026
Source: Based on UN OCHA FTS, Syria Regional Refugee and Resilience Plan (3RP) dashboards and UN High Commissioner for Refugees (UNHCR) data.
Notes: Data is in current prices. 2026 data shows total requirements as of May 2026. Some figures changed slightly from those published in previous GHA reports, largely driven by updates to Syria 3RP data. 2025 and 2026 show two figures for requirements to reflect regular (already prioritised requirements) and hyper-prioritisation activities and resulting requirements in response to significant funding cuts in 2025. GHRP = Global Humanitarian Response Plan.
Funding to UN-coordinated appeals fell for the third year in a row in 2025, reversing a long-term trend in rising funding that peaked in 2022. Appeal funding in 2025 dropped to US $16.6 billion (–35% from 2024) – a level not seen since 2017 and 2018. The drop in funding meant that the humanitarian appeals system had the largest funding gap in history of US $30.6 billion, and the largest funding gap in percentage terms with only 35% of the funding requirement met (and only 56% of prioritised requirements met). The implication of the largest funding gap on record is that millions of people will not have been reached with humanitarian assistance, intensifying the prioritisation of dwindling resources in a system with high needs.
At an organisational level, aid agencies have been forced to prioristise limited resources.
- The quality of existing assistance has been cut in some contexts: cuts to food rations in Kakuma refugee camp in Kenya have led to caloric intake falling and increases in households eating one meal or less a day.[3]
- There has been more focused targeting of assistance: the World Food Programme announced that around 750,000 people in Somalia would stop receiving food assistance due to cuts.[4] The UN High Commissioner for Refugees (UNHCR) warned last year that up to 11.6 million refugees and other people risked losing access to humanitarian assistance from UNHCR.[5]
- The geographic focus of humanitarian assistance has narrowed: a survey of multilateral organisations found that some had lost country presence as a result of the funding cuts.[6]
At a systems-level, the UN-coordinated appeals system has reacted to the historic increase in funding requirements and the more recent funding cuts by prioritising how many people it seeks to reach. The peak in funding requirements was reached in 2023 with US $56.1 billion needed to reach at least 245 million people.[7] Since then, there has been a growing trend to narrow the scope of the humanitarian system and increase prioritisation, with funding requirements shrinking as a consequence.
- 2024: This was the first year of prioritisation within the appeals process, and the Global Humanitarian Overview (GHO) saw funding requirements drop by 12%.
- Early 2025: The second year of the prioritisation exercise saw funding requirements drop by a further 5%.
- Mid-2025: Prioritisation accelerated through a ‘hyper-prioritisation’ exercise. All country and regional responses were reviewed to identify those in most urgent need, resulting in 114 million people targeted out of 300 million people in need. As a consequence, a prioritised funding requirement of US $29.5 billion was introduced – a substantial reduction on the original requirement of US $47.2 billion.
- Late 2025: A standardised formula was introduced in the Humanitarian Programme Cycle (HPC) guidance to calculate the numbers of people targeted and prioritised. People targeted and prioritised include all people in need at intersectoral severity phases 4 and 5, whilst those targeted could include a maximum of 50% of people in phase 3.[8]
- Early 2026: The GHO continued to have an explicit prioritised target and prioritised funding reqiurement. Prioritised funding reqiurements fell to US $23.6 billion – less than half of the funding requirement from previous years. Prioritisation was applied across response plans, with three Humanitarian Response Plans (El Salvador, Guatemala and Honduras) and four Regional Response Plans (Afghanistan, DRC, South Sudan and Ukraine) no longer included in the GHO. The percentage of people prioritised varies widely across response plans, ranging from only 21% and 22% in Niger and Afghanistan, respectively, to 100% in Palestine and Nigeria.[9]
Whilst prioritisation has always been a reality for the humanitarian system – which has never had resources comparable to needs – the concept of prioritisation has now become embedded within the humanitarian architecture and explictly attempts to draw a boundary around what is within scope and out of scope. This has a number of implications.
Firstly, a narrower scope on what is considered ‘humanitarian’ risks erasing millions of people from the narrative – for example, the plans that dropped out of the GHO covered over 20 million people in need in 2025. Secondly, it is not clear if people prioritised for humanitarian assistance will actually receive it, as organisations are unlikely to be able to shift programming within and across countries easily and this will take time to implement in practice. Thirdly, interventions not considered to be life-saving – such as resilience activities that allow transition to longer term development – may fall out of scope of prioritisation and potentially fall through the cracks of humanitarian and development work. Lastly, donors may use the prioritisation framework to focus their funding on prioritised areas and people and, with decreases in general development assistance, this risks more people falling outside the scope of any assistance or services, whether by international or domestic providers.
Whilst the humanitarian system is in a time of flux regarding where to focus limited resources, its overall focus remains concentrated on the same contexts year after year.
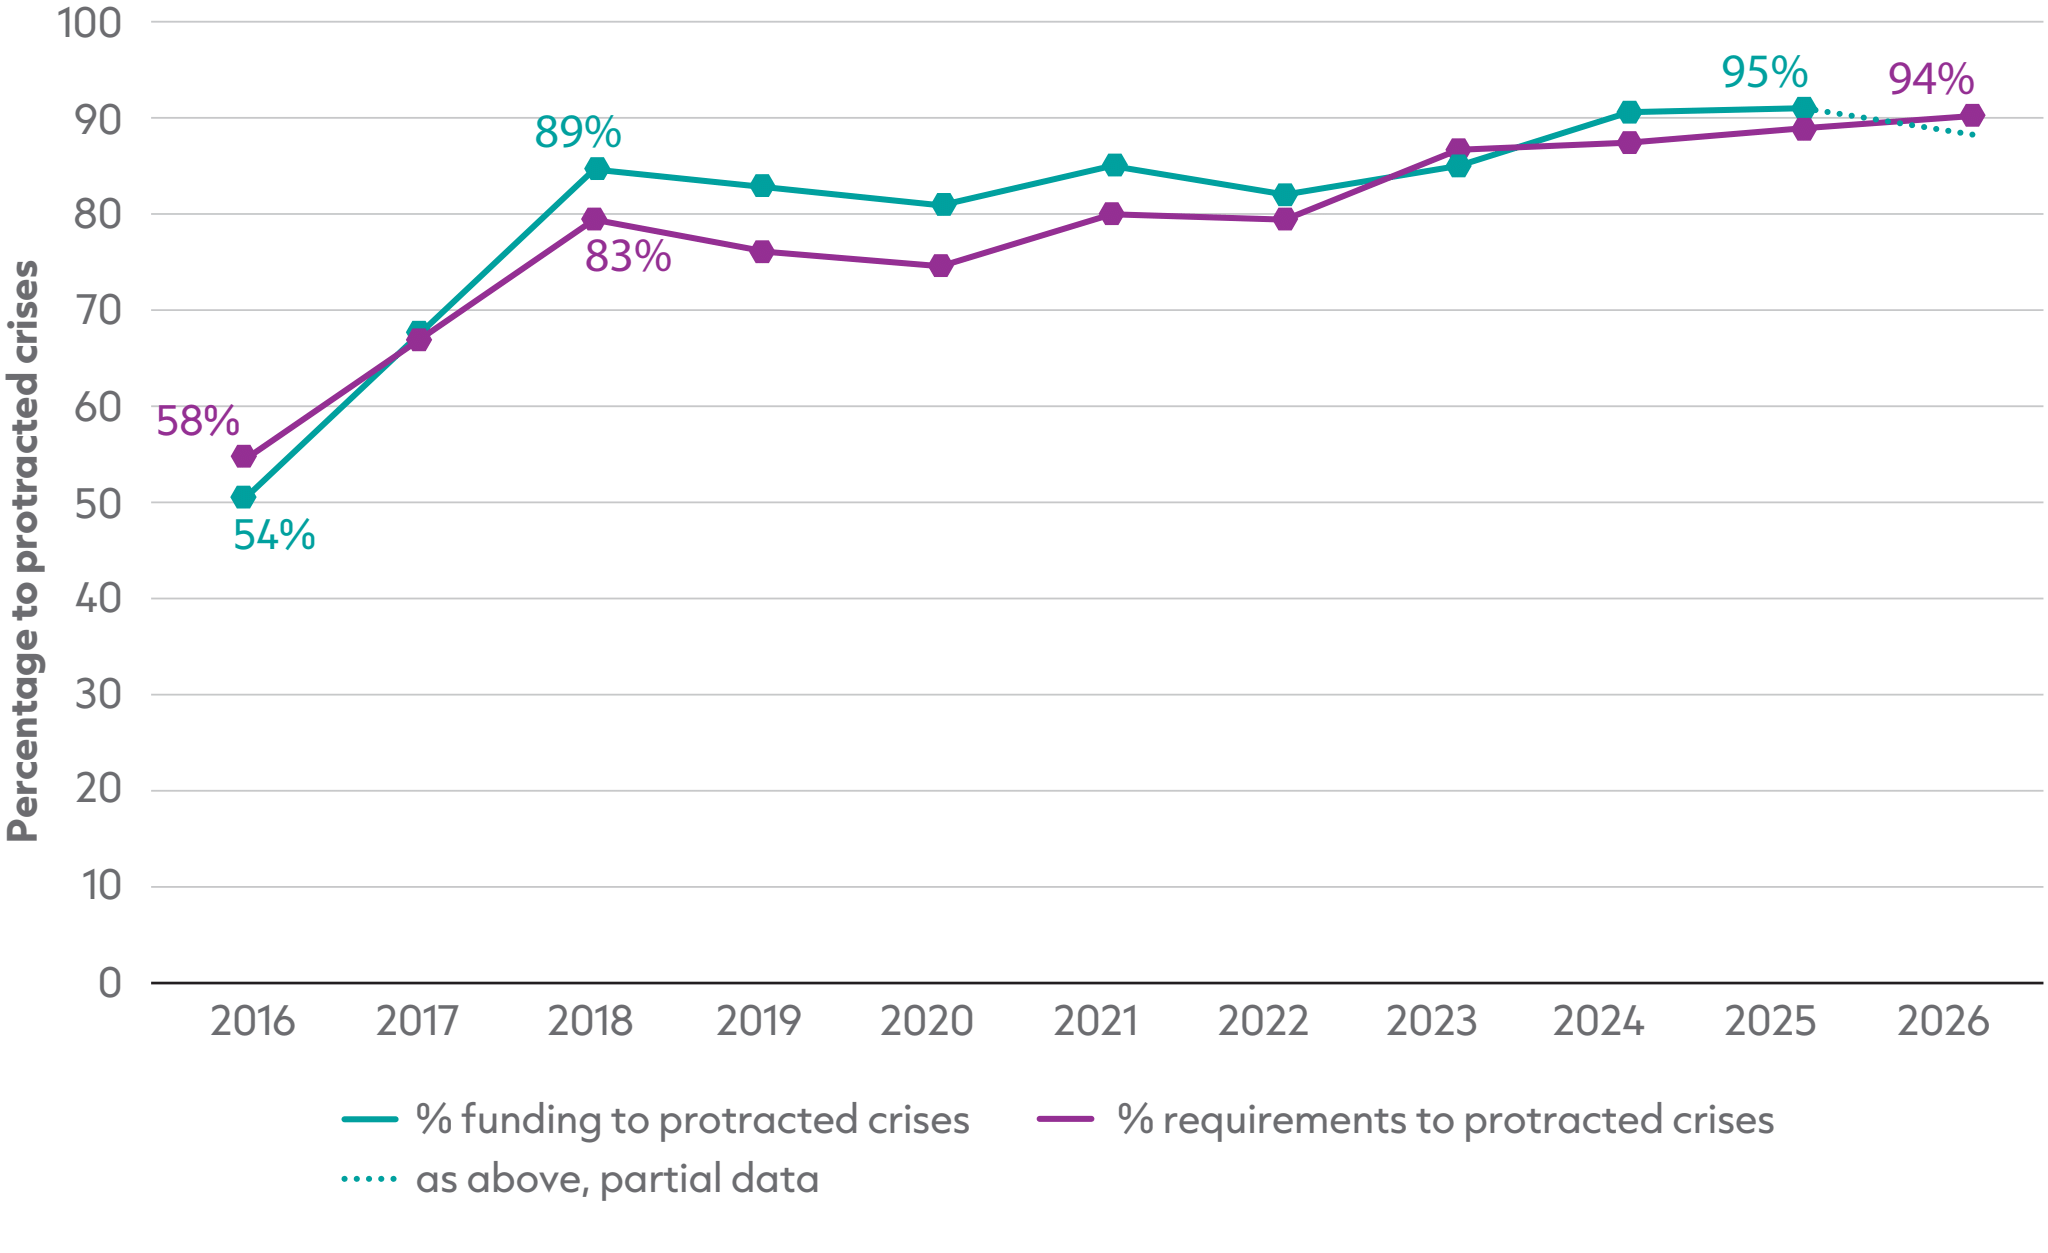
Figure 2.4: 95% of humanitarian funding for UN-coordinated appeals goes to protracted crises contexts
Percentage of funding and overall funding requirements of UN-coordinated appeals focused on protracted crisis contexts, 2016–2026
Source: Based on UN OCHA FTS, Syria 3RP dashboards and UNHCR data.
Notes: Funding for 2026 is preliminary as of May 2026. Contexts are considered to be in protracted crisis when they have had five or more years of consecutive humanitarian appeals; regional appeals are considered to be protracted when they have existed for five or more consecutive years. Funding and requirements not considered to be protracted include UN OCHA-reported appeals that have not existed for five consecutive years. This does not include global appeals, such as the global elements of the COVID-19 Global Humanitarian Response Plan.
Nearly all humanitarian funding for interagency appeals goes to protracted crisis contexts (95% in 2025), closely aligned with the 94% of all funding needed that is for protracted crisis contexts in 2026. These percentages (upwards of 90%) have been the norm since 2024; however this was not always the case. In 2016, only 54% of funding went to protracted crisis contexts.
In absolute terms, protracted crises accounted for US $15.7 billion of the US $16.6 billion of total funding allocated to humanitarian appeals in 2025. This includes three contexts that have had appeals for 27 years (DRC, Sudan and Somalia) and two contexts that have had appeals for 24 years (Central African Republic and Palestine). Together, these contexts account for 35% of total funding for protracted crises in 2025. As of May 2026, 92% of the funding allocated so far this year has been for protracted crisis contexts.
The GHA report defines protractedness as having an interagency response plan for at least five years in a row; therefore, its growing normalisation is largely a function of the ‘stickiness’ of UN-coordinated appeals.
The stickiness of the system – in terms of its difficulty transitioning out of existing contexts – can be seen across a number of dimensions:
- The number of crises that were classified as protracted has risen from 19 of 43 in 2016 to 35 of 46 in 2025.
- The vast majority of the appeals in 2026 have been in place for many years. The average (median) protracted crisis had an interagency plan for 10 years in 2016, rising to 15 years in 2026.
The intersection between protractedness and the scope of humanitarian assistance relative to the other dimensions of the humanitarian–development–peace (HDP) nexus is particularly relevant in the context of funding cuts. One common critique, which prioritisation aims to address, is that the scope of humanitarian response had become too wide, meeting basic needs as opposed to responding to acute shocks, effectively substituting for basic service delivery.
This presents a tension for the humanitarian system. With funding cuts across the HDP nexus, service delivery funded by development assistance will come under increasing pressure, creating more gaps in service provision. At the same time, the humanitarian system is narrowing access to humanitarian assistance through prioritisation, hyper-prioritisation and its own funding constraints. One possible outcome is that the simultaneous retreat of humanitarian and development assistance leaves growing numbers of people falling through the cracks of internationally funded assistance, either within protracted crisis contexts with an appeal or in contexts that have dropped off the appeals list altogether. As such, it is possible that prioritisation will cut deepest where alternative provision is weakest, with protracted crisis contexts particularly vulnerable.
2.5: What is the mix of humanitarian, development and peace funding reaching protracted crises?
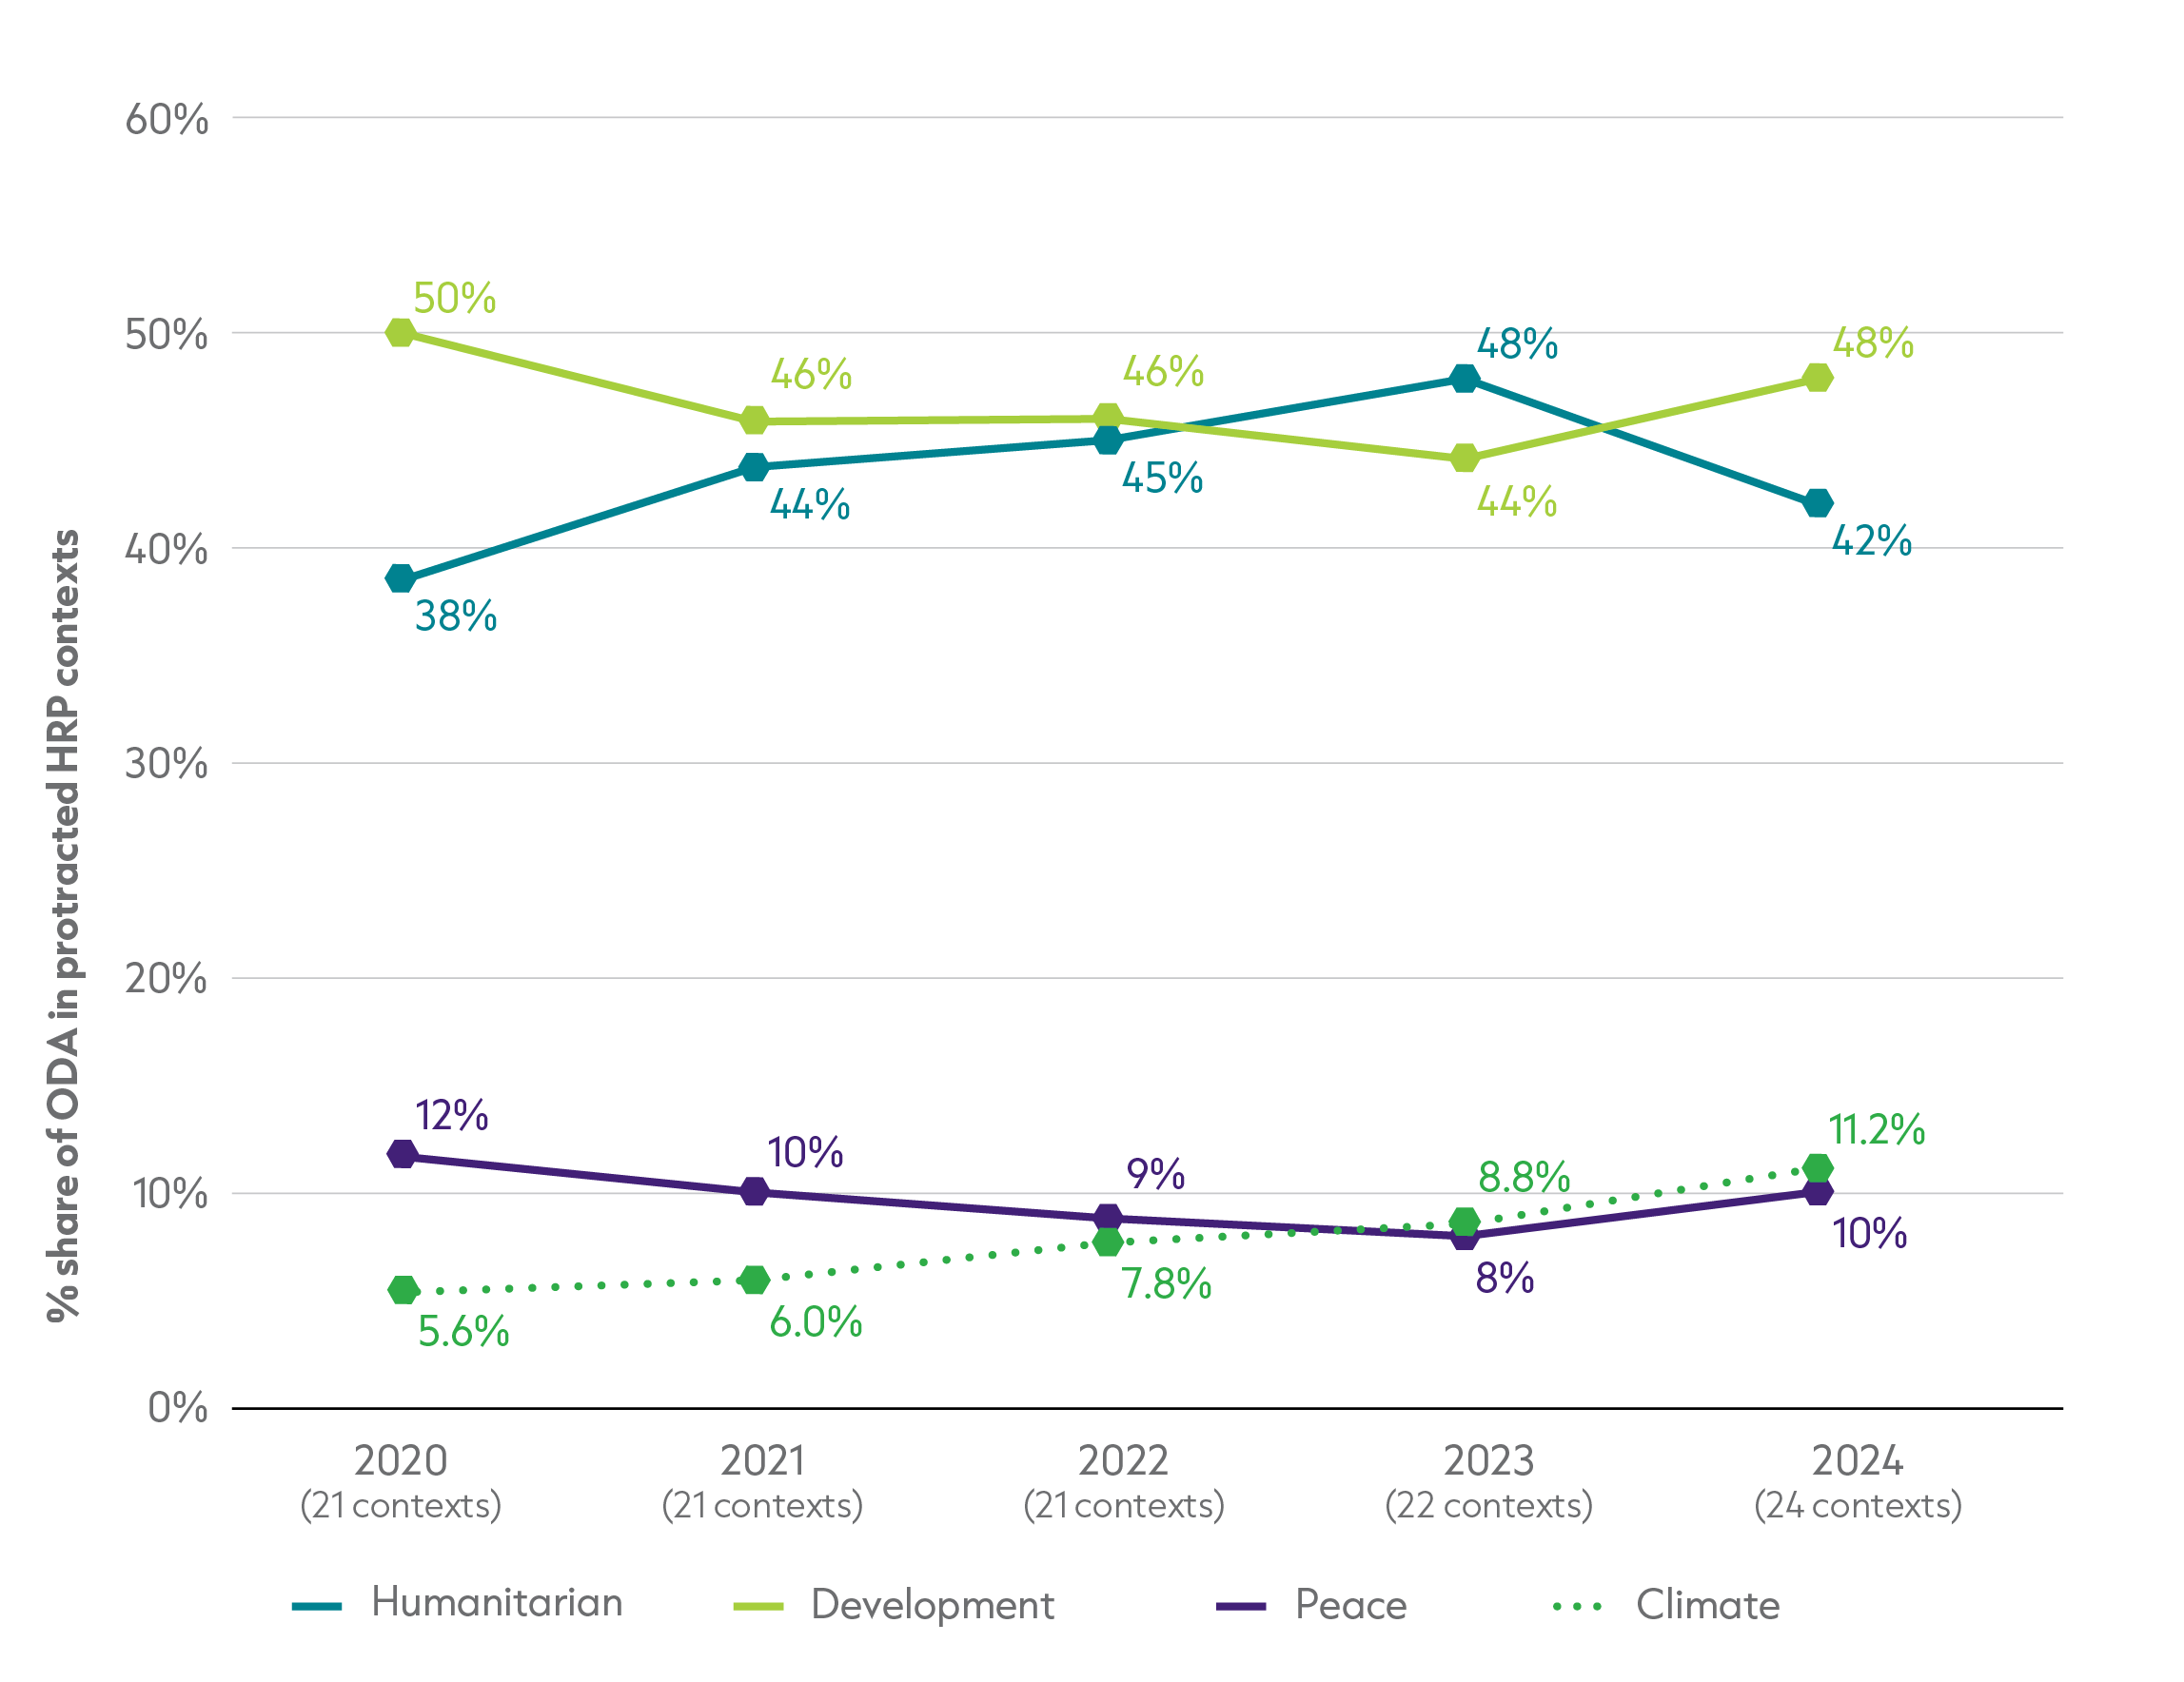
Figure 2.5: Development funding again became the largest share of ODA to protracted crisis contexts in 2024
Source: Based on Organisation for Economic Co-operation and Development (OECD) Development Assistance Committee (DAC) Creditor Reporting System (CRS).
Notes: Excludes Ukraine as a recipient in all years. Recipients vary between years. Climate funding includes the entire activity value for funding tagged with a climate principal marker and 45% of the activity value for those tagged with climate significant marker; this is the median coefficient reported by DAC members for significant climate funding. HRP = humanitarian response plan; ODA = official development assistance.
Total official development assistance (ODA) funding from DAC members to countries experiencing protracted crisis (excluding Ukraine) increased slightly in 2024, and the distribution across systems in the nexus shifted slightly from previous trends.
In 2024 ODA to protracted crises increased by 4% to US $30 billion, up from US $29 billion in 2023 but down from a high of US $32 billion in 2021. Although Ukraine meets the GHA definition of a protracted crisis, it is excluded from this analysis to provide a clearer understanding of the underlying trends across other protracted crisis contexts, given the significant development funding and finance allocated to Ukraine by DAC members since 2022.
Prior to 2024, humanitarian funding accounted for an increasing proportion of ODA to countries experiencing protracted crisis each year. Between 2020 and 2023, humanitarian funding increased steadily from 38.4% to 47.8% of total ODA.
In 2023, humanitarian funding overtook development assistance as the largest category of funding. This stood in contrast to the OECD DAC nexus recommendation, which promotes ‘prevention always, development wherever possible, humanitarian action when necessary’. The increased reliance on the humanitarian system in protracted crises means that humanitarian actors were increasingly stretched to address elements outside of the direct crisis response, including prevention and resilience.
However, 2024 saw a reversal, as development funding increased to 47.7% of ODA in protracted crisis contexts. This was driven by a reduction in humanitarian volumes and a rise in development funding across these contexts. While development funding rose overall, this hides variation between contexts and is partially driven by the inclusion of Colombia and Lebanon as newly classified protracted crises in 2024. Excluding these new contexts, absolute development funding only grew marginally (1%) in 2024. In fact, development funding fell across 12 of the protracted contexts and only increased in 10. Nevertheless, whether or not Colombia and Lebanon are included in 2024, the funding split across the nexus remains as shown: the proportional share of development and peace funding increases, while the humanitarian share falls.
Humanitarian funding fell significantly across 15 of the protracted crisis contexts in 2024. Therefore, humanitarian funding reductions and development funding increases in some contexts made development the largest sector across the nexus again in protracted settings, while humanitarian flows fell back to 42% of ODA in protracted setings. In 2024, the downward trend in the proportion of ODA allocated as peace funding also reversed. Peace funding had fallen from 11.6% of ODA in 2020 to 8.2% in 2023, before rising in both absolute and proportional terms to 10.3% of ODA in 2024.
This relative and absolute fall back in funding for the humanitarian system compared to development and peace funding in 2024 is interesting given the rhetoric around prioritisation. Prioritisation has been led by narratives around narrowing humanitarian action to address immediate and life-saving needs in response to significant and persistent funding gaps, while funding for prevention and resilience is placed more in the remit of other sectors. With significant funding cuts in 2025, changes in the distribution of funding across the nexus will be important to analyse when data is released next year. Difficult donor and system-level decisions about what to prioritise, both within the humantiarian system and across the nexus, were made in 2025; these are likely to result in further shifts in how funding is allocated between sectors.
The funding split across sectors varies significantly between protracted crisis contexts. For example, in 2024 Mozambique received the highest share of development funding (82%) and the second lowest humanitarian share (10%), while Sudan received the highest share of humanitarian funding (74%) and the lowest of development (20%). Libya received the highest share of peace funding (41%), while Yemen received the lowest (5%).
Climate funding makes up a small but growing proportion of ODA to countries in protracted crisis, reaching 11.2% of ODA (US $3.4 billion) in 2024, up from 5.6% (US $1.7 billion) in 2020. Across the period, 7.8% of ODA was reported as climate funding, compared to 11.8% of ODA for other contexts not in protracted crisis. Across protracted crisis contexts, the share of ODA reported as climate funding varies: 17% for Burkina Faso and 1% for Syria.
A lack of data for 2025 means that it isn’t possible to fully understand the split in funding and finance across the HDP nexus in the largest year of cuts on record. As noted in Chapter 1, there is limited evidence that governments are collectively prioritising humanitarian assistance, with some cutting humanitarian budgets more, and some less, than development assistance. How this plays out in protracted crisis contexts is a key question in the context of prioritisation in the humanitarian system.
Share your thoughts on the GHA report!
Read the report? Tell us what you think about the Global Humanitarian Assistance report 2026.
Footnotes
-
Bedasso B., 2026. How African Governments Responded to the 2025 Aid Shock. Centre for Global Development, 10 February 2026. Available at: https://www.cgdev.org/blog/how-african-governments-responded-2025-aid-shock
-
UN OCHA, 2025. Global Humanitarian Overview 2026: Syrian Arab Republic. Available at: https://humanitarianaction.info/document/global-humanitarian-overview-2026/article/syrian-arab-republic-4
-
Bruni V. and Sterck O., 2025. Cut to the bone: The cost of ration cuts and delivery delays in Kenya’s refugee camps. The New Humanitarian, 26 August 2025. Available at: https://www.thenewhumanitarian.org/analysis/2025/08/26/ration-aid-cut-delivery-delays-kenyas-refugee-camps
-
AP News, 2025. U.N. food agency to suspend food aid for 750,000 people in Somalia next month. 3 October 2025. Available at:https://apnews.com/article/somalia-hunger-wfp-7cb9b747dbe452dba374bd6f7164c1c1
-
UNHCR, 2025. UNHCR: As funding cuts bite, some 11m people are losing aid. 18 July 2025. Available at:https://www.unhcr.org/news/briefing-notes/unhcr-funding-cuts-bite-some-11m-people-are-losing-aid
-
MOPAN, 2025. Mapping of Multilateral Organisations’ Response to the Current Funding Environment. Available at: https://alnap.org/ help-library/resources/multilateral-effectiveness-in-a-shifting-landscape-mapping-of-multilateral-organisations-response-to-the-current-funding-environment/
-
UN OCHA, 2023. Global Humanitarian Overview 2024. 11 December 2023. Available at: https://alnap.org/help-library/resources/global-humanitarian-overview-2024/
-
UN OCHA, 2025. HPC 2026: Discussion Paper (Final): Charting the Way Forward in a New Reality. Available at: https://alnap.org/ help-library/resources/humanitarian-programme-cycle-hpc-2026-discussion-paper-charting-the-way-forward-in-a-new-reality/
-
UN OCHA, 2025. Global Humanitarian Overview 2026. Available at: https://alnap.org/help-library/resources/global-humanitarian-overview-2026/