Methodology and definitions
What is humanitarian assistance?
Humanitarian assistance is intended to save lives, alleviate suffering and maintain human dignity during and after human-made crises and disasters associated with natural hazards, as well as to prevent and strengthen preparedness for when such situations occur. Humanitarian assistance should be governed by the key humanitarian principles of humanity, impartiality, neutrality and independence. These are the fundamental principles of the International Red Cross and Red Crescent Movement, which are reaffirmed in UN General Assembly resolutions and enshrined in numerous humanitarian standards and guidelines.
In this report, when used in the context of financing data, international humanitarian assistance refers to the financial resources for humanitarian action spent outside the donor country. Our calculations of international humanitarian assistance are based on what donors and organisations report as such and do not include other types of financing to address the causes and impacts of crises, which we refer to as crisis-related financing.
There is no universal obligation or system for reporting expenditure on international, or indeed domestic, humanitarian assistance. The main reporting platforms for international humanitarian assistance are the Organisation for Economic Co-operation and Development (OECD) Development Assistance Committee (DAC) and the Financial Tracking Service (FTS) of the UN Office for the Coordination of Humanitarian Affairs (OCHA). OECD DAC members are obligated to report their humanitarian assistance to the DAC systems as part of their official development assistance (ODA), in accordance with definitions set out by the DAC.i Some other governments and most major multilateral organisations, including several of the largest private philanthropic foundations, also voluntarily report to the DAC.
The FTS is open to all humanitarian donors and implementing agencies to voluntarily report contributions of internationally provided humanitarian assistance according to a set of inclusion criteria determined by the Inter-Agency Standing Committee.ii
The analysis of international humanitarian assistance in this report draws largely on data reported to the FTS and the OECD DAC. Between these two sources, there is variation in inclusion criteria for humanitarian assistance, as well as volumes reported, so we aim to consistently explain and cite the data sources used. In this report, we have compared the preliminary DAC and FTS data on humanitarian funding by donor in 2025 to capture the most comprehensive data possible, as explained in more detail below. We include humanitarian funding reported to the FTS that has been provided by OECD DAC members to countries not eligible for ODA. We also use other sources to calculate international humanitarian assistance, including reports from UN agencies and non-governmental organisations (NGOs) on private humanitarian funding and data from the Central Emergency Response Fund (CERF) on contributions from public donors; data sources and methodologies for these are also clearly marked and explained.
Infographic – key humanitarian trends
The infographic on key humanitarian trends is based on various sources of data:
- Forced displacement: Source: United Nations High Commissioner for Refugees (UNHCR) global trends. Refugees (under both UNHCR and United Nations Relief and Works Agency for Palestine Refugees in the Near East (UNRWA)), and asylum seekers have been grouped together into one category.
- Food security: Source: Global Report on Food Crises dataset produced by the Food Security Information Network. The dataset sources data from: Integrated Food Security Phase Classification, Cadre Harmonisé, Famine Early Warning Systems Network and Humanitarian Needs Overviews. Data in this infographic reflects the most recent version of the dataset available at the time of writing: The Global Report on Food Crises (GRFC) 2026.
- Conflict: Source: Armed Conflict Location and Event Data Project (ACLED); www.acleddata.com. Data displayed starts in 2018 as this is the most recent year with broadly comparable data across years. Data was extracted on 3 April 2026.
- Aid worker security: Source: Aid Worker Security Database, Humanitarian Outcomes. Data was extracted on 16 April 2026.
- UN appeal requirements: Source: UN OCHA FTS, UNHCR's Refugee Funding Tracker, and Syria Regional Refugee and Resilience Plan (3RP) Dashboard.
- UN appeals – people in need and targets: Source: UN OCHA Global Humanitarian Overview 2025 and UN OCHA Global Humanitarian Overview 2026.
- Disasters: Source: Emergency Events Database (EM-DAT). Figures reflect number of people affected by disaster type.
Infographic – top donors
The infographic on top donors is based on various sources of data:
- Figures for total funding from donors are for 2025, expressed in 2024 constant prices to align with other analyses in the report. These figures exclude imputed EU contributions to humanitarian assistance.
- Likewise, the percentage of all public donors pertains to donor totals excluding EU imputations.
- Spend as a percentage of gross national income (GNI) uses 2025 total funding data and 2025 GNI data taken from the OECD DAC latest preliminary data as released in April 2026. GNI comparisons for Saudi Arabia are based on 2024 data due to a lack of DAC preliminary data for 2025.
- Spend as a percentage of ODA uses the same OECD DAC preliminary data release.
- Spend as a percentage of ODA figures for Saudi Arabia, Qatar and the United Arab Emirates uses 2024 data due to a lack of 2025 data – both numerator and denominator are from the OECD DAC.
- Data for top sectors and top contexts are taken from FTS with data extracted in April 2026. Multiple sectors, multi-sector and multipurpose cash have been combined into one category. Multi-sector often refers to multisectoral assistance provided by UNHCR for refugee settings. Agriculture has been combined with food security.
- ‘Top contexts’ excludes funding to global projects or unspecified locations but includes funding to multiple countries.
Infographic – crises
The infographic on crises is based on various sources of data:
- Protracted crises: the number of years displayed next to each context denotes the number of years of consecutive response plans. Sources: Number of years of response plans from UN OCHA FTS. Ethiopia is displayed as a protracted crisis of 10 years despite the lack of response plan since 2024 as humanitarian needs are high and the lack of response plan does not reflect a lack of humanitarian need.
- Crisis drivers: Source: INFORM Severity Index; March 2026 release. Change compared to one year earlier and the March 2025 release.
- Severity: Source: INFORM Severity Index; March 2026 release. Change compared to one year earlier and the March 2025 release.
- Access constraints: Source: ACAPS Humanitarian Access Overview; April 2026 release. Change compared to one year earlier and the April 2025 release.
- Internally displaced persons (IDPs): Source: IDMC's Global Internal Displacement Database. Number refers to totals displaced as of 2025 across both conflict and violence, and disasters. Change compared to 2024 figures.
- Food insecurity: Source: Global Report on Food Crises (GRFC) datasets. Number refers to those in Integrated Food Security Phase Classification (IPC) Phases 3 or above (i.e. crisis, emergency or famine). Where possible, latest figures are taken from the 2025 mid-year update, which uses 2025 as the year of reference. Where latest figures are not available, figures are taken from the 2025 GRFC edition, which uses 2024 as the year of reference. Depending on the data source for the primary figure used, the change on the previous year uses either the 2024 or 2024 mid-year update for the calculation.
- Refugees abroad: Source: UNHCR refugee data finder. Change compared to 2024 figures.
- People in need: Source: 2026 Global Humanitarian Overview.
- People targeted: Source: 2026 Global Humanitarian Overview.
- People prioritised: Source: 2026: Global Humanitarian Overview.
- Top donors: Source: UN OCHA FTS. This analysis reflects the analysis undertaken for Figure 2.2.
- Refugee and host community population: Source: 2026 Global Humanitarian Overview and individual response plan documents.
- Funding for regional response plans: Source: UN OCHA FTS and UNHCR’s Refugee Funding Tracker.
Anticipatory action
Humanitarian financing to anticipatory action initiatives is not systematically collected in the usual data sources, such as OECD DAC or FTS. Our estimates of funding for anticipatory action are based on data collected by the Anticipation Hub, which compiles two datasets. One dataset details how much funding is available to active anticipatory action frameworks, while the other dataset details how much is disbursed when the framework is activated. We adapted the Anticipation Hub’s dataset on active frameworks by adding data on anticipatory action activations that did not have corresponding data in the frameworks dataset.
Cash and voucher assistance (CVA)
Our global estimate of humanitarian assistance provided in the form of cash and vouchers in 2025 is based on data collected directly from implementing organisations by the CALP Network and supplemented with FTS and HPC Project Module data. The methodology used is based on methods devised for previous reports.iii This methodology utilises machine learning to identify CVA-related funding in funding flows or project descriptions in FTS or the HPC Project Module.
Channels of delivery
We use ‘channels of delivery’ to describe the first and subsequent levels of organisations receiving funding for the delivery of humanitarian assistance – multilateral agencies, NGOs (both international and local/national), the public sector and the International Red Cross and Red Crescent Movement – whether they deliver the assistance themselves or pass it on to partner organisations. Our data on channels of delivery in Figure 3.1 (Chapter 3) comes from the FTS.
Country and region naming conventions
Country and region naming conventions used throughout this report are based on those used by the OECD DAC or the UN. Region naming conventions are based on those used by the OECD. Where country names are shortened to three-letter acronyms, countries follow Fédération Internationale de Football Association (FIFA) country codes for readability. The conventions used do not reflect a political position of ALNAP.
Deflators
Where appropriate in performing analyses of financial trends, we adjust for inflation by applying deflators in constant 2024 prices by source location of the funding. We use US $ gross domestic product deflators from the OECD DAC for DAC members and EU institutions and calculate deflators from the International Monetary Fund World Economic Outlook April 2026 data for other countries. In the limited cases where data is missing from both of these sources, and for financial flows that have a multilateral source, we deflate using the ODA-weighted average DAC deflator from the OECD.
Donor blocs
At various points in the GHA report, donors are grouped together based on various affiliations. The ‘top four DAC donors’ are the US, EU institutions, the UK and Germany. Other DAC donors are all other members of the OECD Development Assistance Committee (DAC). ‘Gulf donors’ refers to governments that are members of the Gulf Cooperation Council. Unless otherwise stated, ‘EU institutions’ and ‘EU member states’ refer only to those countries. An ‘EU plus’ bloc is referred to, which includes like-minded countries (Iceland, Liechtenstein, Norway and Switzerland) as well as EU institutions and EU member states.
Excluding funding flows
There has been an uptick in large (>US $ 25 million) omnibus projects that have been reported to UN OCHA FTS. As part of the process for calculating total international humanitarian assistance, a review of these projects was undertaken to determine if any should be excluded from being counted as international humanitarian assistance and subsequent GHA analyses.
To conduct this review, project descriptions were used as the primary method to determine exclusions. Other fields on the FTS, including the destination plan or emergency destination organisation type and destination location field, were used as additional supporting information.
The threshold for exclusion is high, with the default position that a flow present in FTS is international humanitarian assistance. Projects with descriptions that lack detail, including those that are effectively empty, are not excluded. Projects with descriptions that are ambiguous, unclear or appear partially linked to humanitarian operations are not excluded. Projects that are coded with a non-blank field for destination emergency or destination humanitarian plan are not excluded.
A project is only excluded where it is determined to unambiguously and solely represent funding for any of the following:
- Commercial or private sector operations outside of immediate crisis response
- Large-scale construction projects, including infrastructure and energy
- General budget support to government, civil or public administration
- Economic development outside of immediate crisis response
- Global programmes oriented to long-term goals, non-specific to crisis contexts
Where relevant, the ‘destination organisation type’ field is used to identify projects that are commercial or private sector operations, and the ‘destination location’ field is used to identify projects with a global focus.
Funding for local and national actors
Our analysis of funding to local and national actors in Figures 3.2 (Chapter 3) is based on FTS data, alongside data from the International Federation of Red Cross and Red Crescent Societies (IFRC) Network Databank, International Organization for Migration (IOM) grant awards data, UN OCHA Country Based Pooled Fund (CBPF) Data Hub, United Nations Children's Fund (UNICEF) Transparency Portal, UNHCR collaboration with funded partners, and World Food Programme (WFP) field-level expenditures data.
The methodology used follows the same methodology as the Humanitarian Policy Group paper, The state of international humanitarian funding to local and national actors, which itself is an evolution of GHA methodologies.iv As such, figures shown here are not directly comparable with past GHA reports due to the inclusion of further datasets.
Classification of organisation type (e.g. national NGOs, UN agencies) is taken from the FTS. Data from the CBPF Data Hub uses the funds’ own classifications of recipients.
Gross national income (GNI)
Estimates of humanitarian assistance as a percentage of GNI are calculated using donor international humanitarian assistance figures and GNI figures sourced from the OECD DAC preliminary data for 2025.
Humanitarian–development–peace nexus, and climate financing
Analysis of what constitutes humanitarian, development and peace funding follows the same classification used by Development Initiatives and the Swedish International Development Cooperation Agency in the report Leaving no crisis behind with assistance for the triple nexus: Humanitarian, development and peace funding in crisis contexts.v Humanitarian assistance is identified using the following purpose codes: 72010, 72040, 72050, 73010 and 74020. Peace assistance is identified using the following purpose codes: 15210, 15220, 15230, 15240, 15250, 15261, 15113, 15130, 15150, 15151, 15152, 15153, 15160, 15170, 15180 and 15190. All other purpose codes are classified as development assistance.
Funding on climate-related activities uses the Rio markers, and ODA marked as having the principal objective of climate mitigation or climate adaption is included at 100% of its value. Where an activity is marked as having climate mitigation or climate adaptation as a significant objective, the activity is included at 45% of its value. This is the median coefficient reported by DAC members for activities with a ‘significant’ objective.vi
Icons
Directional arrows are used at various points in the report in figures and infographics. These arrows denote change over time. Where a value lies between –5% and +5%, a hexagon icon is used to denote ‘no substantial change’. Where a value is less than –5%, a down arrow icon is used to denote a substantial downward trend. Where a value is more than +5%, an up arrow icon is used to denote a substantial upward trend. The colour of the arrow icons is dependent on the analysis.
International humanitarian assistance
Our estimate of total international humanitarian assistance is the sum of that from private donors and from public donors (i.e. government donors and EU institutions) – see Figure 1.1, Chapter 1. Our calculation of international humanitarian assistance from government donors is the sum of:
- ‘Official’ humanitarian assistance (OECD DAC donors)
- International humanitarian assistance from OECD DAC donors to countries not eligible for ODA from the FTS
- International humanitarian assistance from donors outside the OECD DAC using data from the FTS.
Our ‘official’ humanitarian assistance calculation comprises:
- The bilateral humanitarian expenditure of OECD DAC members, as reported to the OECD DAC database under Table 2A
- The multilateral humanitarian assistance of OECD DAC members.
The multilateral humanitarian assistance of OECD DAC members consists of three elements:
- The unearmarked ODA contributions of DAC members to key multilateral agencies engaged in humanitarian responses as reported to the OECD DAC under Table 2a and the OECD Creditor Reporting System (CRS). We do not include all ODA for some agencies but apply a percentage to take into account that these agencies also have a ‘development’ mandate. These shares are calculated using data on humanitarian expenditure as a proportion of the total received directly from each multilateral agency.
- The ODA contributions of DAC members to some other multilateral organisations that, although not primarily humanitarian-oriented, do report a level of humanitarian assistance to OECD DAC Table 2a. We do not include all reported ODA to these multilateral organisations but just the humanitarian share of this.
- Contributions to the UN CERF that are not reported under DAC members’ bilateral humanitarian assistance. We take this data directly from the UN CERF website.
When presenting the international humanitarian assistance of individual OECD DAC countries that contribute to the EU budget, we show in Figure 1.3 (Chapter 1) an imputed calculation of their humanitarian assistance channelled through the EU institutions, based on their ODA contributions to the EU institutions. We do not include this in our total international humanitarian assistance and response calculations or in our ranking of donor contributions to avoid double counting, given the EU institutions are also presented as a donor separately.
Our estimate for official humanitarian assistance in 2025 compares preliminary data by donor between DAC and FTS to reflect the most comprehensive data available. Where humanitarian assistance reported to FTS was greater than official humanitarian assistance based on DAC data as defined above, we used FTS data. Where humanitarian assistance reported to FTS was greater than bilateral humanitarian assistance based on DAC data only, we used FTS data plus imputed multilateral humanitarian assistance based on DAC data. Otherwise, we used an estimate of official humanitarian assistance based on DAC data only. In individual cases, judgment was used to determine which data source to use and/or some donors were contacted individually to validate the accuracy of publicly available information. For our analysis of funding by donor on FTS we used the flow year for paid contributions and the destination usage year for commitments to try and capture funding in the year it was or expected to be disbursed. FTS data was downloaded on 17 April 2026.
Historic international humanitarian assistance figures were calculated for the first ever GHA report to enable a comparison with recent international humanitarian assistance data.
People in need of assistance
The number of ‘people in need’ referred to in the report is taken from UN OCHA’s Global Humanitarian Overview series.
Pooled funds
Data on allocations from pooled funds in Chapter 3 is based on data from the CBPF section at OCHA, as well as the CERF Data Hub.
The data shown under Figure 3.6 is a partial view of 2026 as it was downloaded on 25 May 2026. Projects funded by US contributions were determined by using the US contributions page on the CBPF data hub. Projects funded by other contributions include all other projects not funded through US contributions, using the regular CBPF data hub, with US-funded projects excluded based on CBPF project codes.
Private funding
We request financial information directly from humanitarian delivery agencies (including NGOs, multilateral agencies and the International Red Cross and Red Crescent Movement) on their income to create a standardised dataset on private humanitarian funding received by them. Where direct data collection is not possible, we use publicly available annual reports and audited accounts. The dataset in each year may differ in terms of which organisations are included. For the most recent year, our dataset includes:vii
- A large sample of NGOs, such as Médecins Sans Frontières and Oxfam
- Private contributions to the Food and Agriculture Organization, IOM, United Nations Population Fund, UNHCR, UNICEF, UNRWA and WFP
- The International Federation of Red Cross and Red Crescent Societies and the International Committee of the Red Cross.
Our private funding calculation comprises an estimate of total private humanitarian income for all NGOs and the private humanitarian income reported by UN agencies, the International Federation of Red Cross and Red Crescent Societies and the International Committee of the Red Cross. To estimate the total private humanitarian income of NGOs globally, we calculate the annual proportion that the NGOs in our dataset represent of NGOs reporting to UN OCHA FTS. The total private humanitarian income reported to us by the NGOs in our dataset is then scaled up accordingly.
Data is collected annually, and new data for previous years may be added retrospectively, or previous year totals updated.
Protracted crisis
Our definition of protracted crisis includes contexts with five or more consecutive years of UN-coordinated appeals, as of the year of analysis. This aligns with the historic definition of protracted crisis as applied by Development Initiatives in prior GHA reports. The types of appeals and response plans used to determine this classification are outlined in ‘UN-coordinated appeals’.
We have chosen this approach to give an indication of the contexts that have consistently, for a number of years, experienced humanitarian needs at a scale that requires an international humanitarian response. These needs can be limited to specific geographical regions or populations (such as forcibly displaced people).
Countries experiencing protracted crises can be split into two categories. In the first instance, ‘countries’ are the unit of analysis for response plans that target people within a country’s recognised borders. These tend to be humanitarian response plans, flash appeals, and other types of appeals. The analysis in Figure 2.5 (Chapter 2) reflects this, with only country contexts selected in this case.
In the second instance, ‘regional crises’ are added to the scope of analysis with regional response plans included. For example, the Rohingya Joint Response Plan and Syria 3RP are considered as protracted crises as these plans have existed for five or more years. The analysis in Figure 2.4 (Chapter 2) reflects this wider definition, and reflects all country-specific and regional response plans.
Rounding
There may be minor discrepancies in some of the totals in our charts and infographics, and between those in the text, because of rounding.
Scenarios
In recent years, the GHA report has produced scenarios for how much funding could be received in the current calendar year. This is challenging for a number of reasons.
Firstly, information on budgets may be fast moving and dependent on budgetary negotiations in the political arena that might not be legislated for at the time of analysis. Secondly, whilst some donors may announce budgetary changes to their total ODA, often these announcements do not have breakdowns regarding the humanitarian portion of their ODA. Thirdly, where budget changes are phased over a period of time, it is not always clear when these changes will take place (e.g. steep cuts in the first year of a parliament or phased over time). Fourthly, the financial or budgetary year for some donors does not align with the calendar (e.g. the US government’s fiscal year runs from October to September). Fifthly, many donors don’t publish forward-looking budgetary information. And, lastly, whilst budgets may be published, disbursements do not necessarily always reflect the budgets (e.g. due to initial pledges not being met or approved in finance bills, disbursements being made late, or additional disbursements or reallocations during the year). As a result, it would be challenging to forecast humanitarian spending with any degree of certainty.
The challenge of understanding funding flows is made more difficult when private donors are taken into account – there is no one source of information or press release to refer to. Therefore, the scenarios presented only refer to public funding (i.e. that from governments and EU institutions) and not to private funding.
Two scenarios have been examined: an ‘optimistic scenario’ and a ‘pessimistic scenario’.
These scenarios are based on publicly available information at the time of publication and account for the uncertainty noted above, as well as for the usual fluctuations in humanitarian funding. Private funding is not examined, and countries that are not members of the OECD DAC, or rank within the top 20 donors, are assumed to contribute the same as in 2025.
To better understand potential changes in humanitarian donor contributions for 2026, a triangular distribution was used to model uncertainty – with the three values in each distribution given by the assumptions in the table below:
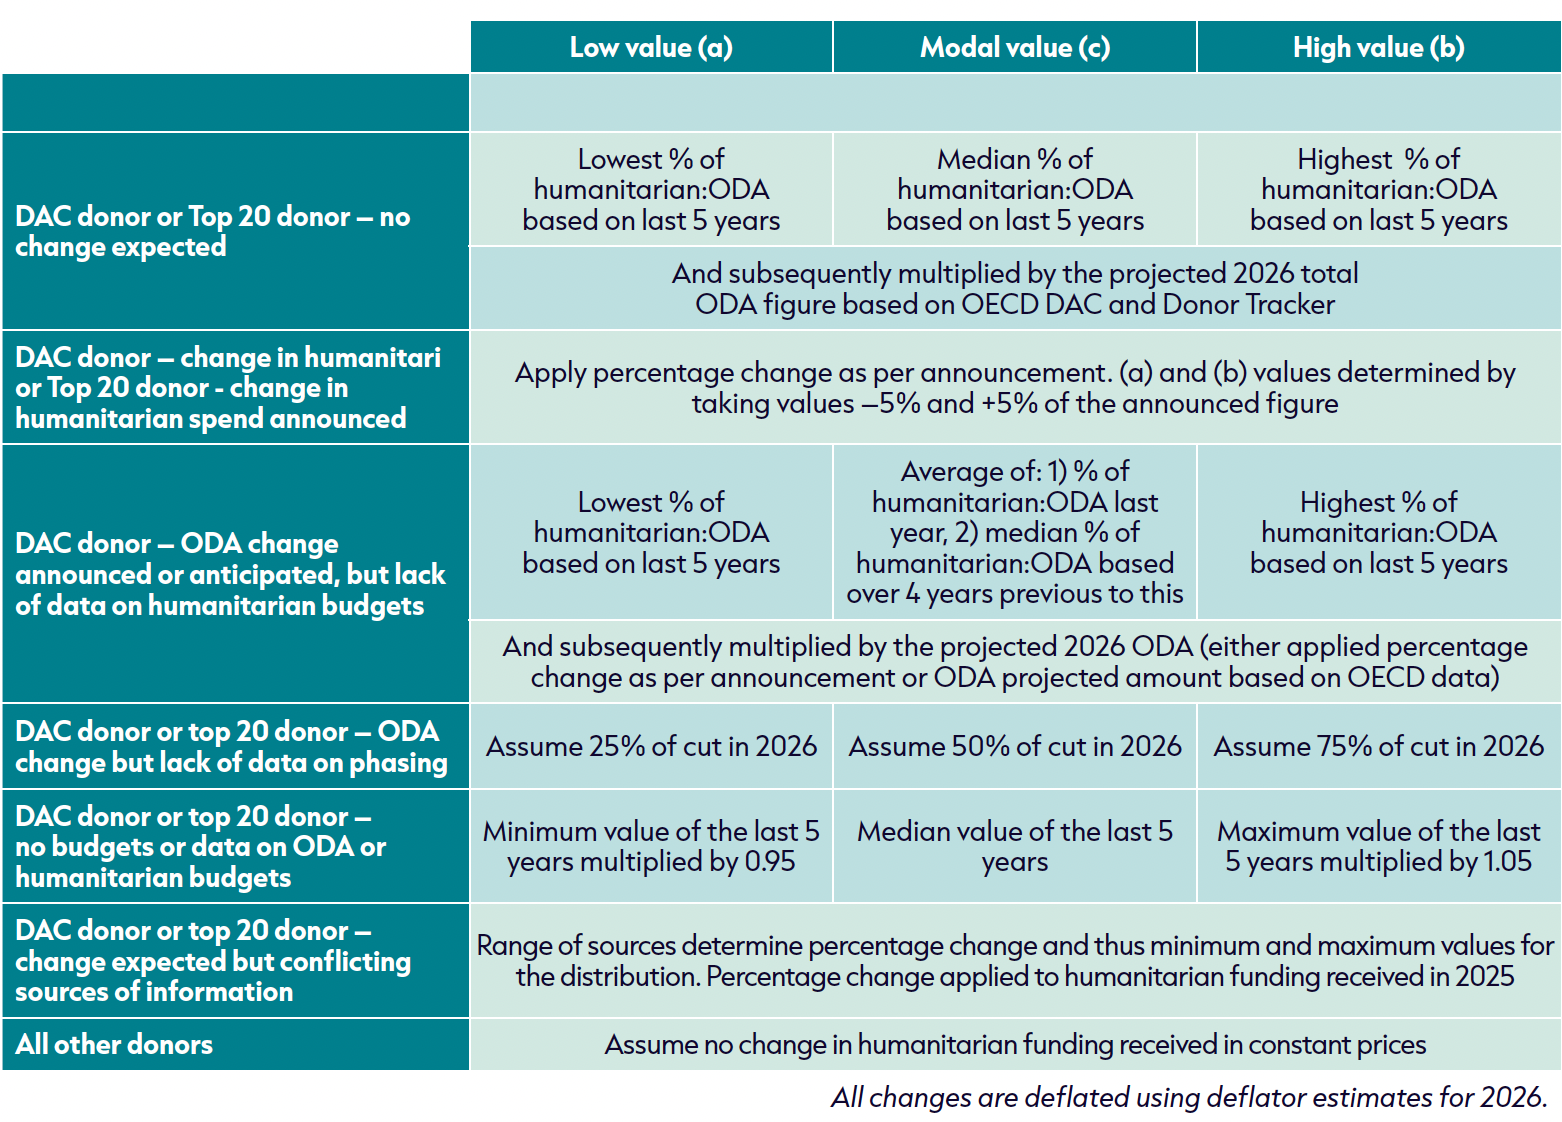
A sense check is then undertaken to determine if the ranges produced are realistic based on historical precedent. In cases where the range of values is over 1.5x the historical range of values in the last five years, an average of the calculated value and the minimum or maximum value over the last five years is calculated to reduce the range of values. This occurs in a limited number of cases.
Using these distributions, 10,000 possible outcomes were simulated using a technique known as Monte Carlo simulation, which helps to explore a wide range of plausible futures rather than relying on a single estimate.
From these simulations, we constructed three funding scenarios:
- An optimistic scenario: based on the 97.5th percentile of the simulations
- A pessimistic scenario: based on the 2.5th percentile.
UN-coordinated appeals
We use this term to describe all humanitarian response plans and appeals wholly or jointly coordinated by UN OCHA or UNHCR, including humanitarian response plans, flash appeals, joint response plans, regional refugee response plans, and other plans. We use data from UN OCHA FTS, UNHCR and the Syria 3RP dashboard for our financial analysis of UN-coordinated appeals in Figures 2.3 and 2.4 (Chapter 2). Data for UN-coordinated plans (funding received and funding requirements) were downloaded in April 2026.
Data sources
ACAPS
INFORM Severity Index
https://data.humdata.org/dataset/inform-global-crisis-severity-index
Humanitarian Access Overview
https://www.acaps.org/en/thematics/all-topics/humanitarian-access-overview
Anticipation Hub
Anticipatory Action Overview Reports
https://www.anticipation-hub.org/global-overview/global-snapshot/overview-reports
Armed Conflict Location and Event Data (ACLED)
Political violence events by country-year
Donor Tracker | SEEK Development
Individual donor profiles
Food Security Information Network
Global Report on Food Crises
https://data.humdata.org/dataset/fsin-grfc
Grand Bargain
Grand Bargain Self-Reports
Humanitarian Outcomes
Aid Worker Security Database
https://www.aidworkersecurity.org/
International Federation of Red Cross and Red Crescent Societies
IFRC Network Databank
International Monetary Fund (IMF)
World Economic Outlook Database
https://www.imf.org/en/Publications/WEO
International Organization for Migration (IOM)
IOM Awarded contracts, grants recipients, and selected implementing partners
https://www.iom.int/awarded-contracts-grants-recipients-and-selected-implementing-partners
Organisation for Economic Co-operation and Development (OECD)
OECD Creditor Reporting System, Deflators, Providers’ total use of the multilateral system, Table 1 and Table 2A
https://data-explorer.oecd.org/
OECD DAC Preliminary 2025 data
https://webfs.oecd.org/oda/DataCollection/Resources/2025-preliminary-data.xlsx
OECD DAC ODA Projections
https://webfs.oecd.org/oda/DataCollection/Resources/ODA-projections-2025.xlsx
ReliefWeb
Individual response plans
Syria Regional Refugee and Resilience Plan (3RP)
3RP Financial Dashboards
https://www.3rpsyriacrisis.org/dashboards/
United Nations Children's Fund (UNICEF)
Transparency tool (Funding)
https://open.unicef.org/transparency-tool
UN High Commissioner for Refugees (UNHCR)
Displacement
https://www.unhcr.org/uk/mid-year-trends
Donors
https://reporting.unhcr.org/donors/
Refugee funding tracker
https://refugee-funding-tracker.org
UNHCR partner data
UN Office for the Coordination of Humanitarian Affairs (OCHA)
Central Emergency Response Fund (CERF) Data Hub
Financial Tracking Service
Country Based Pooled Funds (CBPF) Data Hub
https://cbpf.data.unocha.org/
Country Based Pooled Funds (CBPF) Data Hub – US contributions
https://cbpf.data.unocha.org/us
Humanitarian Programme Cycle API
https://api.hpc.tools/docs/v2/
Global Humanitarian Overview Reports
https://reliefweb.int/topics/global-humanitarian-overview
UN Relief and Works Agency for Palestine Refugees in the Near East (UNRWA)
Donor charts
https://www.unrwa.org/how-you-can-help/government-partners/funding-trends/donor-charts
World Food Programme (WFP)
WFP NGO field-level agreements
https://www.wfp.org/non-governmental-organizations
World Bank
International Debt Report
https://www.worldbank.org/en/programs/debt-statistics/idr/products