Humanitarian reform and delivery
3.1: Summary
3.2: How is funding allocated across the sector?
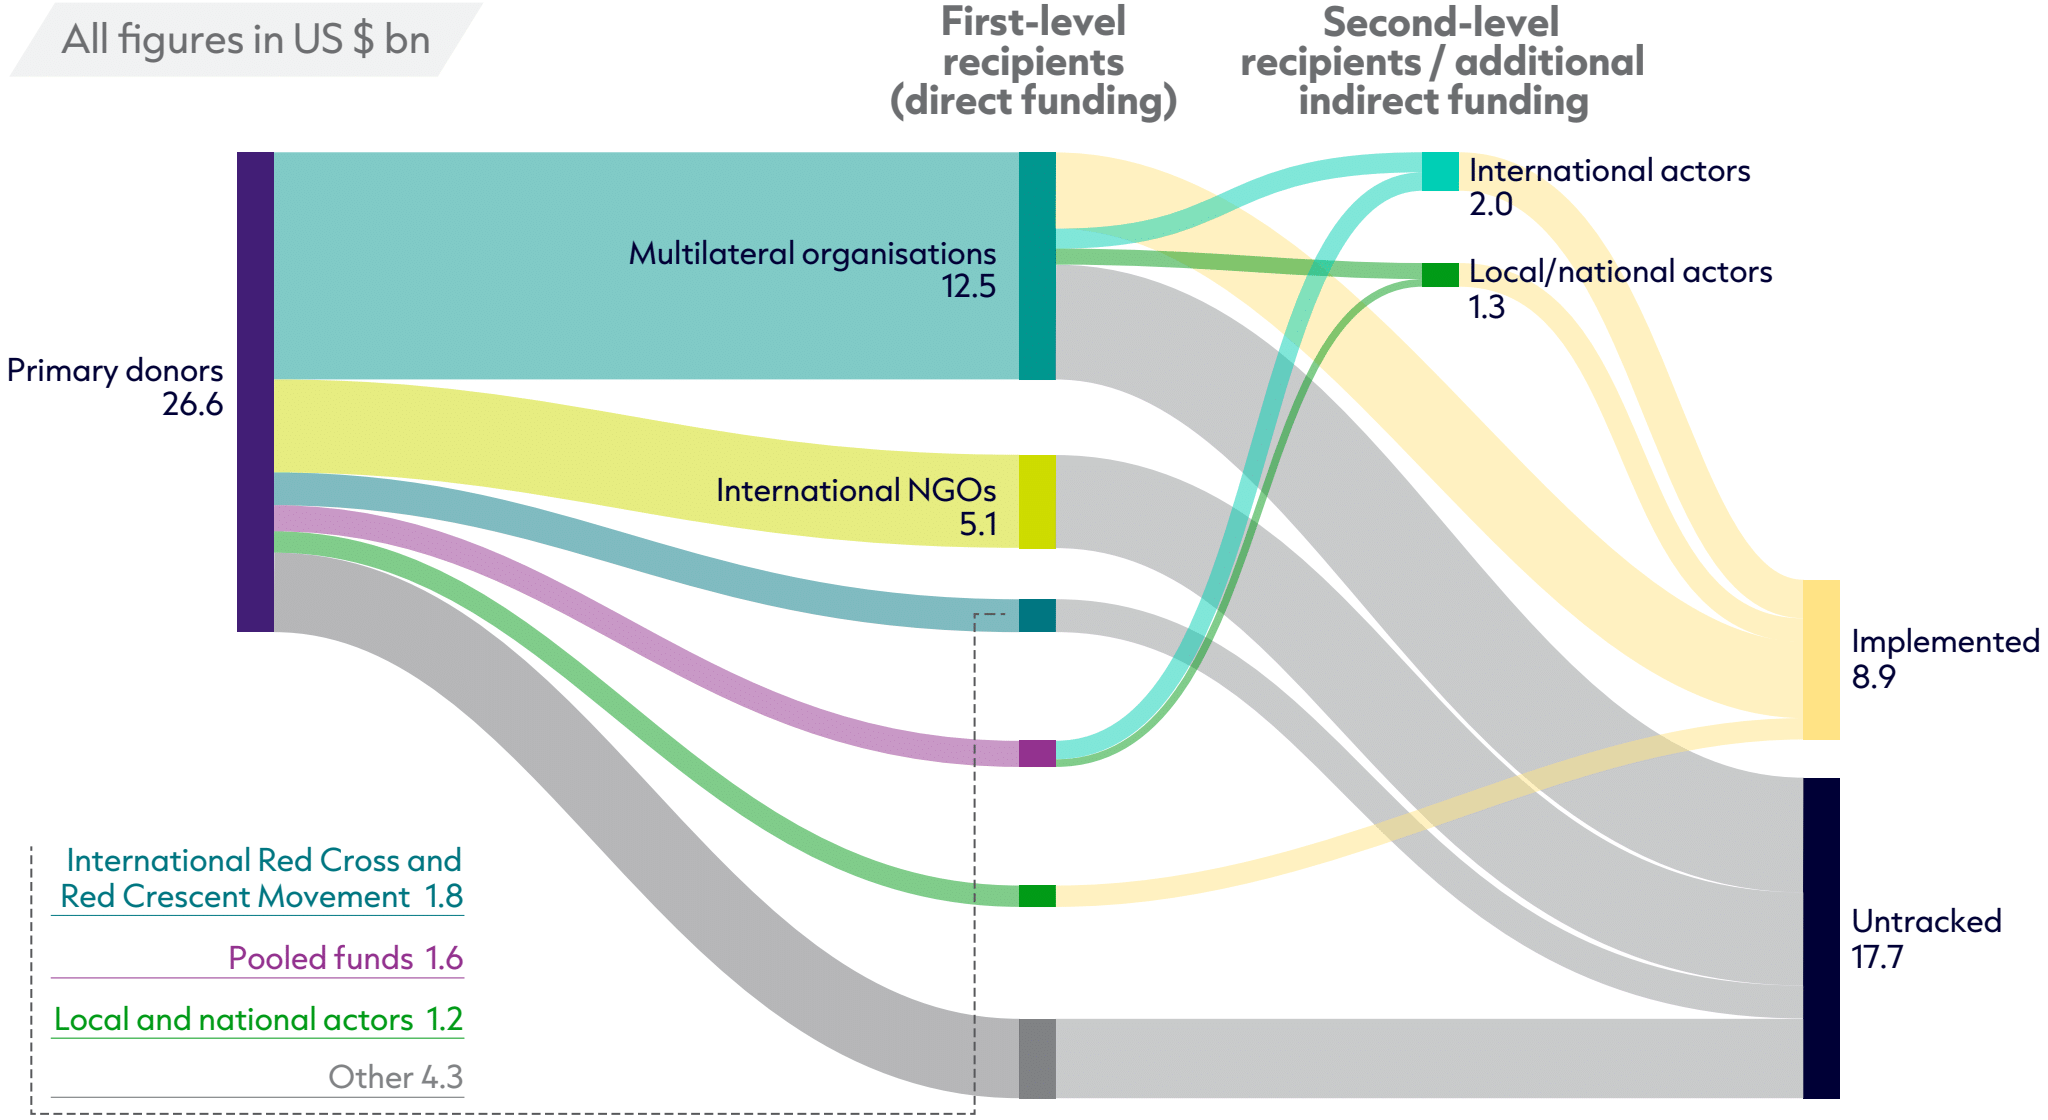
Figure 3.1: Multilateral organisations remain the largest recipient group, absorbing half of all direct donor funding in 2025
Proportion of funding by different recipient organisation types (UN, NGOs and governments)
Source: UN Office for the Coordination of Humanitarian Affairs (OCHA) Financial Tracking Service (FTS), International Organization for Migration (IOM) grant awards data, UN OCHA Country-Based Pooled Funds (CBPF) Data Hub, United Nations Children’s Fund (UNICEF) Transparency Portal, UN High Commissioner for Refugees (UNHCR) collaboration with funded partners.
Notes: Funding allocated by UN agencies with partner data (IOM, UNICEF, World Food Programme (WFP) and UNHCR) in each year are taken from their own reports where available. The total displayed for pooled funds is equal to allocations as opposed to contributions, which is lower; this has then been reconciled at the primary donors’ level. Data is in constant 2024 prices.
Of the trackable funding reported by primary donors (public and private in the Financial Tracking Service (FTS)), multilateral organisations were the largest recipient group in 2025, receiving almost half (47%) of primary donor funding in 2025 (US $12.5 billion).
- International NGOs received 19% of primary donor funding (US $5.1 billion).
- The International Red Cross and Red Crescent Movement received 7% (US $1.8 billion).
- Pooled funds received 6% (US $1.6 billion).
- Local and national actors as first-tier recipients received only 5% of funding (US $1.2 billion).[1]
- ‘Other’ organisations – including flows to donor development agencies and private individuals and organisations – received 16% of funding (US $4.3 billion). The majority of this (US $3.5 billion) was sourced from Gulf states.
The breakdown of funding by recipient type remained largely unchanged between 2024 and 2025, especially for international NGOs, the International Red Cross and Red Crescent Movement, pooled funds, and local and national actors. However, the share to multilateral organisations dropped from 58% in 2024 to 47% in 2025. While they remained the largest recipient group, the volume allocated to multilaterals fell by 38% (down from US $20.1 billion in 2024).
- This was largely driven by cuts from the US, as US funding through multilaterals fell from US $9.6 billion in 2024 to US $3.4 billion in 2025 – a 65% reduction.
- German cuts also significantly impacted multilaterals, as funding from Germany to multilaterals fell from US $1.6 billion in 2024 to US $676 million in 2025 – a 58% fall.
Organisations categorised as ‘other’ saw an increase in their share of allocations between 2024 to 2025, rising from 7% to 16% of all first-level funding. This was primarily due to increased reporting from Gulf donors (primarily UAE, Qatar and Saudi Arabia) on funding for their own government humanitarian agencies.
First-tier direct funding is either implemented by recipient organisations or is subsequently passed onto further humanitarian organisations, sometimes through multiple intermediaries. Two thirds of funding (US $17.4 billion) is untracked beyond the first tier, obscuring the picture on how funding moves through the system before reaching target populations. This lack of transparency also challenges efforts to track the Grand Bargain commitment on increasing aggregate funding to local and national actors.
- Of the funding that can be tracked beyond the first tier, US $2 billion was allocated to international actors – including UN bodies, coordinated funds and international NGOs.
- US $1.3 billion of all tracked indirect funding was allocated to local and national actors – including local and national NGOs and government bodies.
- Multilaterals passed on US $807 million of this indirect funding to local and national actors – almost all of this came from UN High Commissioner for Refugees (UNHCR) and United Nations Children’s Fund (UNICEF). This partly reflects the fact that data from some other multilaterals was not available at the time of writing.
- Pooled funds provided the second-largest amount of funding passed on to local and national actors, with US $469 million directly from pooled funds.
3.3: Is funding increasing for local and national actors?
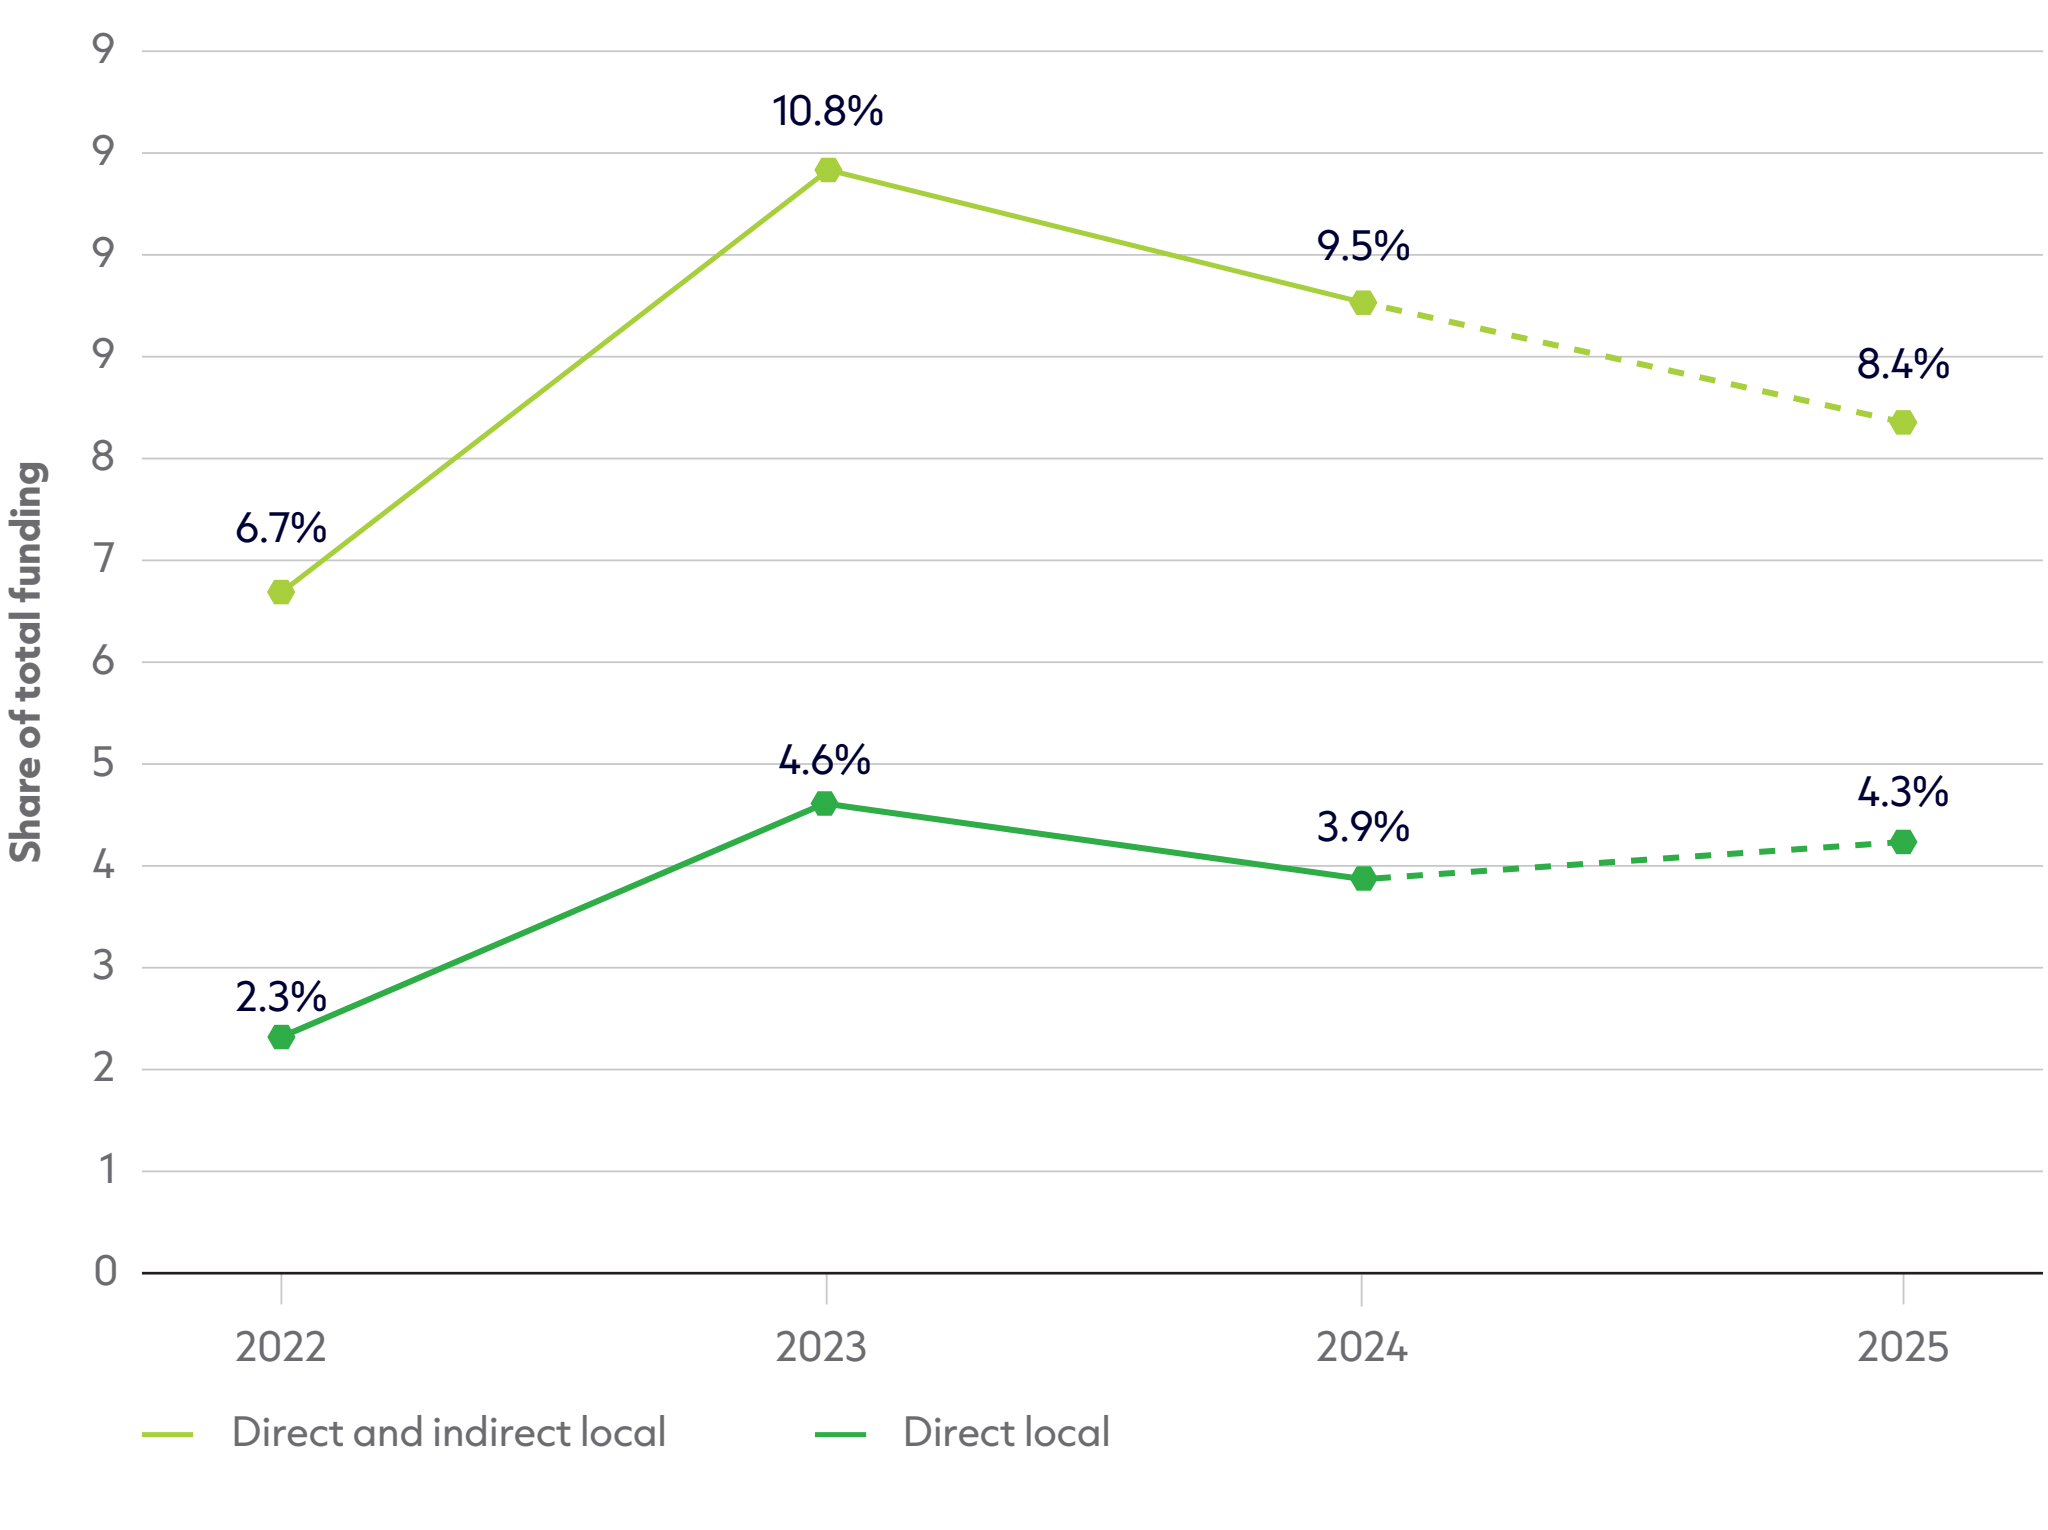
Figure 3.2: Total funding to local and national actors fell again, while minor increases in direct funding were driven by Gulf donor allocations to national governments
Proportion of direct and total (direct and indirect) funding to local and national actors, 2022–2025
In 2016, the Grand Bargain committed all signatories to collectively provide 25% of global humanitarian funding to local and national responders ‘as directly as possible’. A decade on, localised funding levels have failed to meet the target and remain at inadequate levels. Trends between 2022 and 2023 showed some indications that collective efforts to increase both direct allocations and pass-through funding were culminating in progress towards the goal. However, trends over the past two years have shown that this was likely an inflated increase due to improved reporting rather than a material shift.
This reporting artefact further reinforces the importance of transparent reporting for monitoring the sector’s key commitments. Despite improvements from some multilateral agencies and increased reporting from Gulf donors, there is a lack of consistent and complete data on funding passed down to local and national actors. Of reported humanitarian funding, based on data for direct flows from FTS and partial data for indirect flows (FTS, country-based pooled funds (CBPFs), UNHCR, UNICEF, International Organization for Migration (IOM)), funding to local and national actors totalled an estimated US $2.4 billion in 2025, a reduction from 2024.
- 8.7% of all reported humanitarian flows were directly and indirectly allocated to local and national actors in 2025, a fall from 9.5% in 2024.
- Localised funding decreased in volume substantially in 2025 (–27%), outstripping overall humanitarian funding reductions (–20% at the point of receipt).
As a proportion of overall funding, direct funding flows to local and national actors increased slightly from 3.9% in 2024 to 4.3% in 2025. However, the volume of direct funding fell 12% compared with the previous year, so therefore a less severe reduction than overall funding cuts (20%). However, this was down to substantial amounts provided by Gulf donors to national governments, included within the category of ‘national actor’.
- In 2025, Saudi Arabia provided US $381 million to the Government of Yemen, US $182 million to the Government of Syria and US $95 million to the Government of Palestine.
- Qatar provided US $76 million to the Government of Tajikistan. The United Arab Emirates provided US $52 million to the Government of Chad.
Indirect funding to local and national actors totalled US $1.3 billion (4.4% of total funding), of which US $794 million was reported through partner agencies. Decreases in indirect localised funding occurred across partner organisations. Large decreases were reported by UNHCR and UNICEF.
- UNHCR reported a 31% decrease in humanitarian funding for local and national actors from 2024. The agency itself received a 27% decrease in total funding between 2024 and 2025.
- UNICEF reported a 45% decrease in humanitarian funding for local and national actors from 2024.
- Importantly, data for 2025 is partial, with partner data for the World Food Programme and International Federation of Red Cross and Red Crescent Societies not yet available. Data for these partners is instead sourced through FTS, which limits the visibility of indirect flows to local and national actors.
3.4: How much funding is available for cash and voucher assistance?
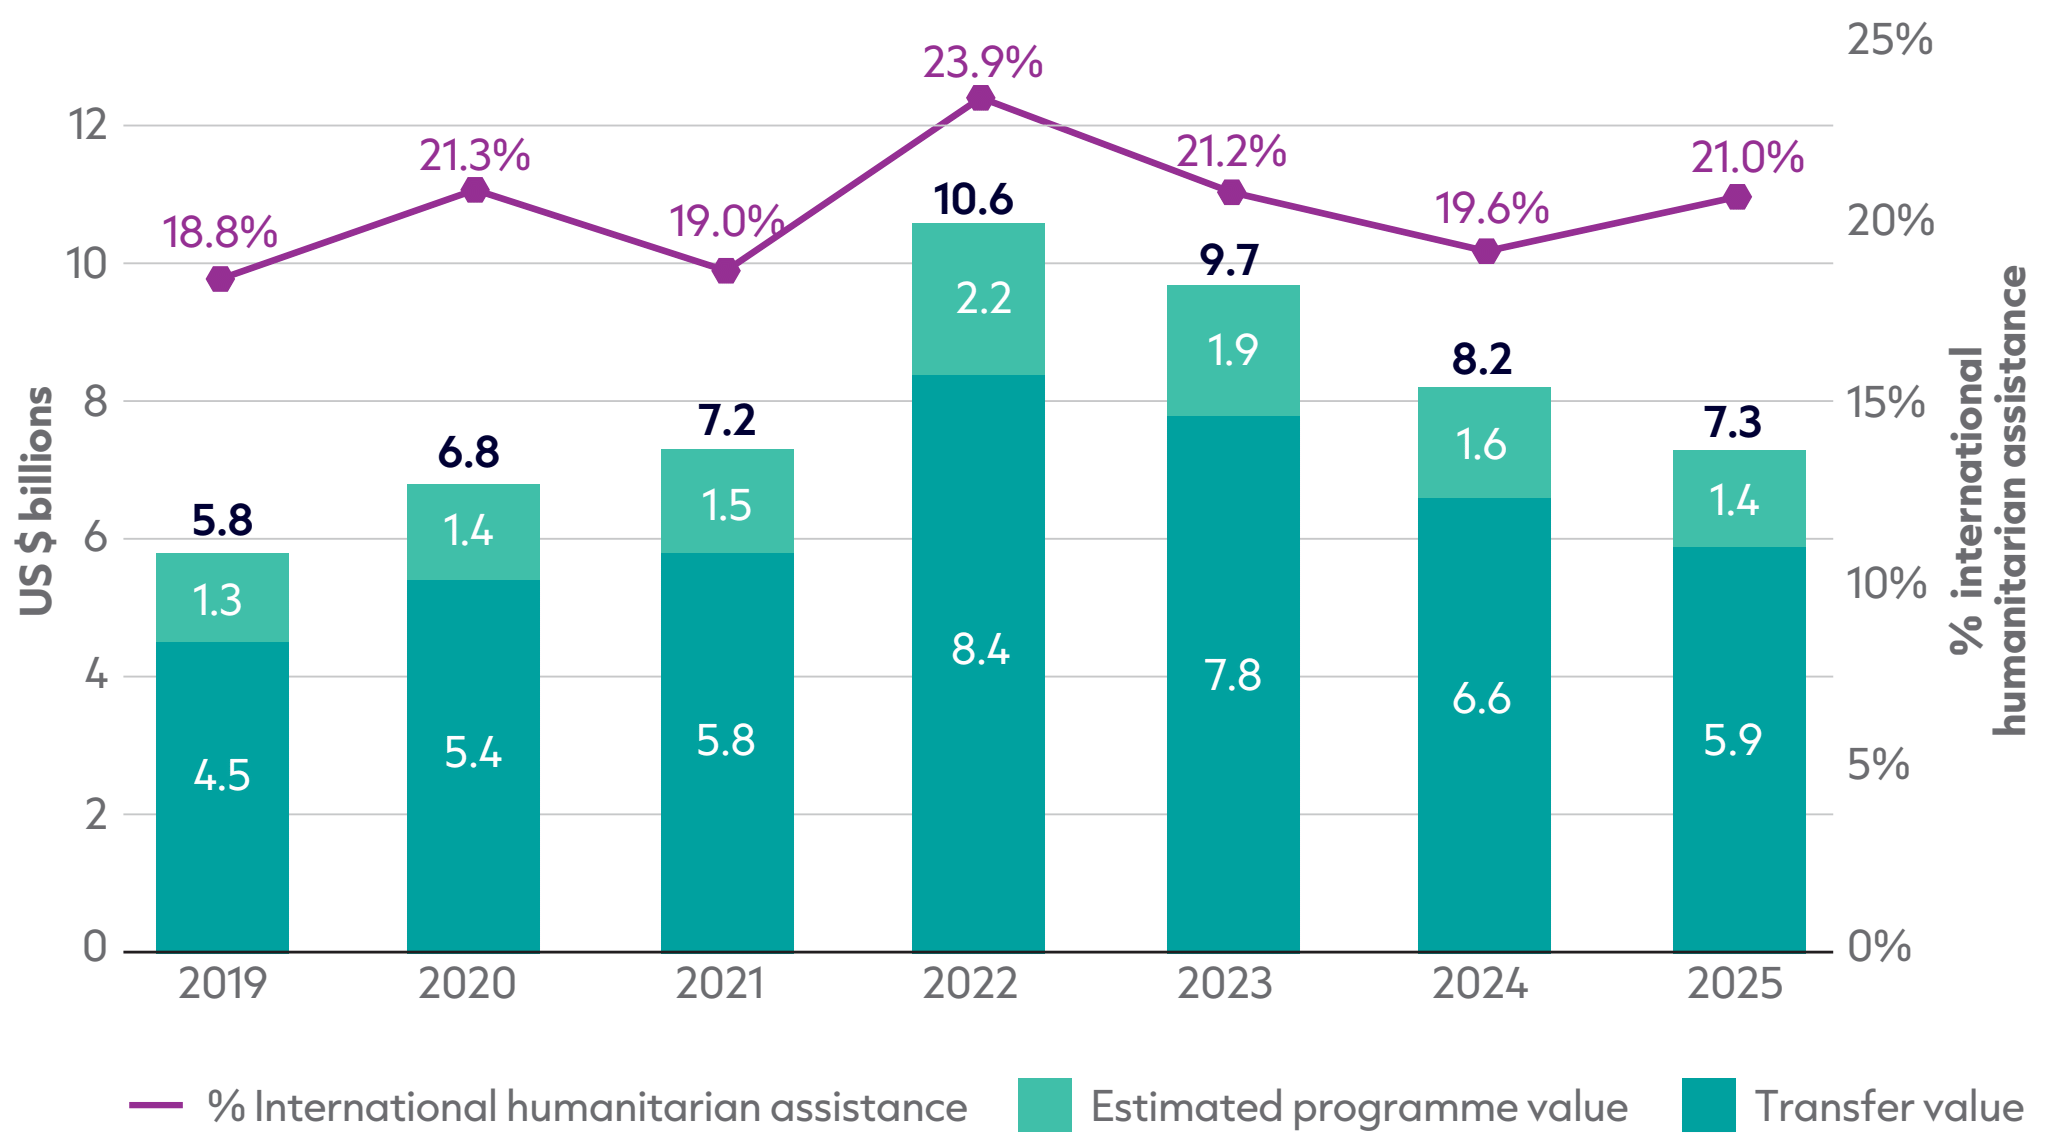
Figure 3.3: While humanitarian CVA volumes fell for the third year in a row, as a proportion of total humanitarian assistance CVA held its ground
Humanitarian assistance for CVA programming, 2019–2025
Source: Data on cash and volunteer assistance (CVA) volumes was collected by the CALP Network from implementing partners and supplemented with estimates based on the UN OCHA FTS and HPC Projects Module.
Notes: CVA volumes are estimates based on provided survey responses and supplemented with estimates based on FTS data. For a few organisations that have consistently reported surveys over the past eight years but weren’t able to submit in time this year, an estimate was used based on their reported volume in 2024. Double counting of CVA programmes that are sub-granted from one implementing partner to another is avoided where data on this is available. Transfer values for funding captured on FTS and HPC Projects are estimates based on the average ratio of transfer values to overall programming costs for organisations with available data. Data is not available for all included organisations across all years. Data is in current prices. CVA = cash and voucher assistance; HPC = Humanitarian Programme Cycle.
A focus on humanitarian cash and voucher assistance (CVA) is more important than ever: in a system facing severe resource constraints, cash not only extends the reach of limited funding, but also – by restoring choice to recipients and enabling locally led delivery – offers a pathway to a more dignified and accountable humanitarian response.
Funding allocated for CVA in 2025 held onto its share of shrinking humanitarian assistance, marginally increasing as a proportion of total humanitarian assistance, reaching 21.0% – up from 19.6% in 2024.
However, volumes of CVA funding fell by 11% to US $7.3 billion, down from US $8.2 billion in 2024. The fact that cash did not increase through funding cuts in 2025 represents a missed opportunity to leverage the efficiency of cash to reach more people with limited resources.[3]
2025 was the third consecutive year that humanitarian CVA volumes fell, falling 15% in 2024 and 8% in 2023. Compared with its 2022 peak of US $10.6 billion, 2025 volumes are down 31% – back down to volumes last seen in 2021.
The share CVA holds of total humanitarian assistance stayed fairly steady from 2020 to 2025, with the exception of 2022 when the increase was largely driven by a focus on multi-purpose cash in the humanitarian response to Ukraine that year. Breaking through this ceiling of around 20% of humanitarian assistance being CVA finance will require concerted political effort to operationalise existing cash policies within the Humanitarian Reset, Common Donor Approach to Humanitarian Cash Assistance, Grand Bargain and agency-level commitments.
UN agencies and their implementing partners continued to deliver the majority (56%) of CVA in 2025, with NGOs delivering 25%, the International Red Cross and Red Crescent Movement delivering 17%, and other organisations delivering below 2%.
Further analysis of CVA volumes and trends will follow in the CALP Network’s 2026 State of the World’s Cash report in November 2026.[4]
3.5: What progress is being made on anticipatory action?
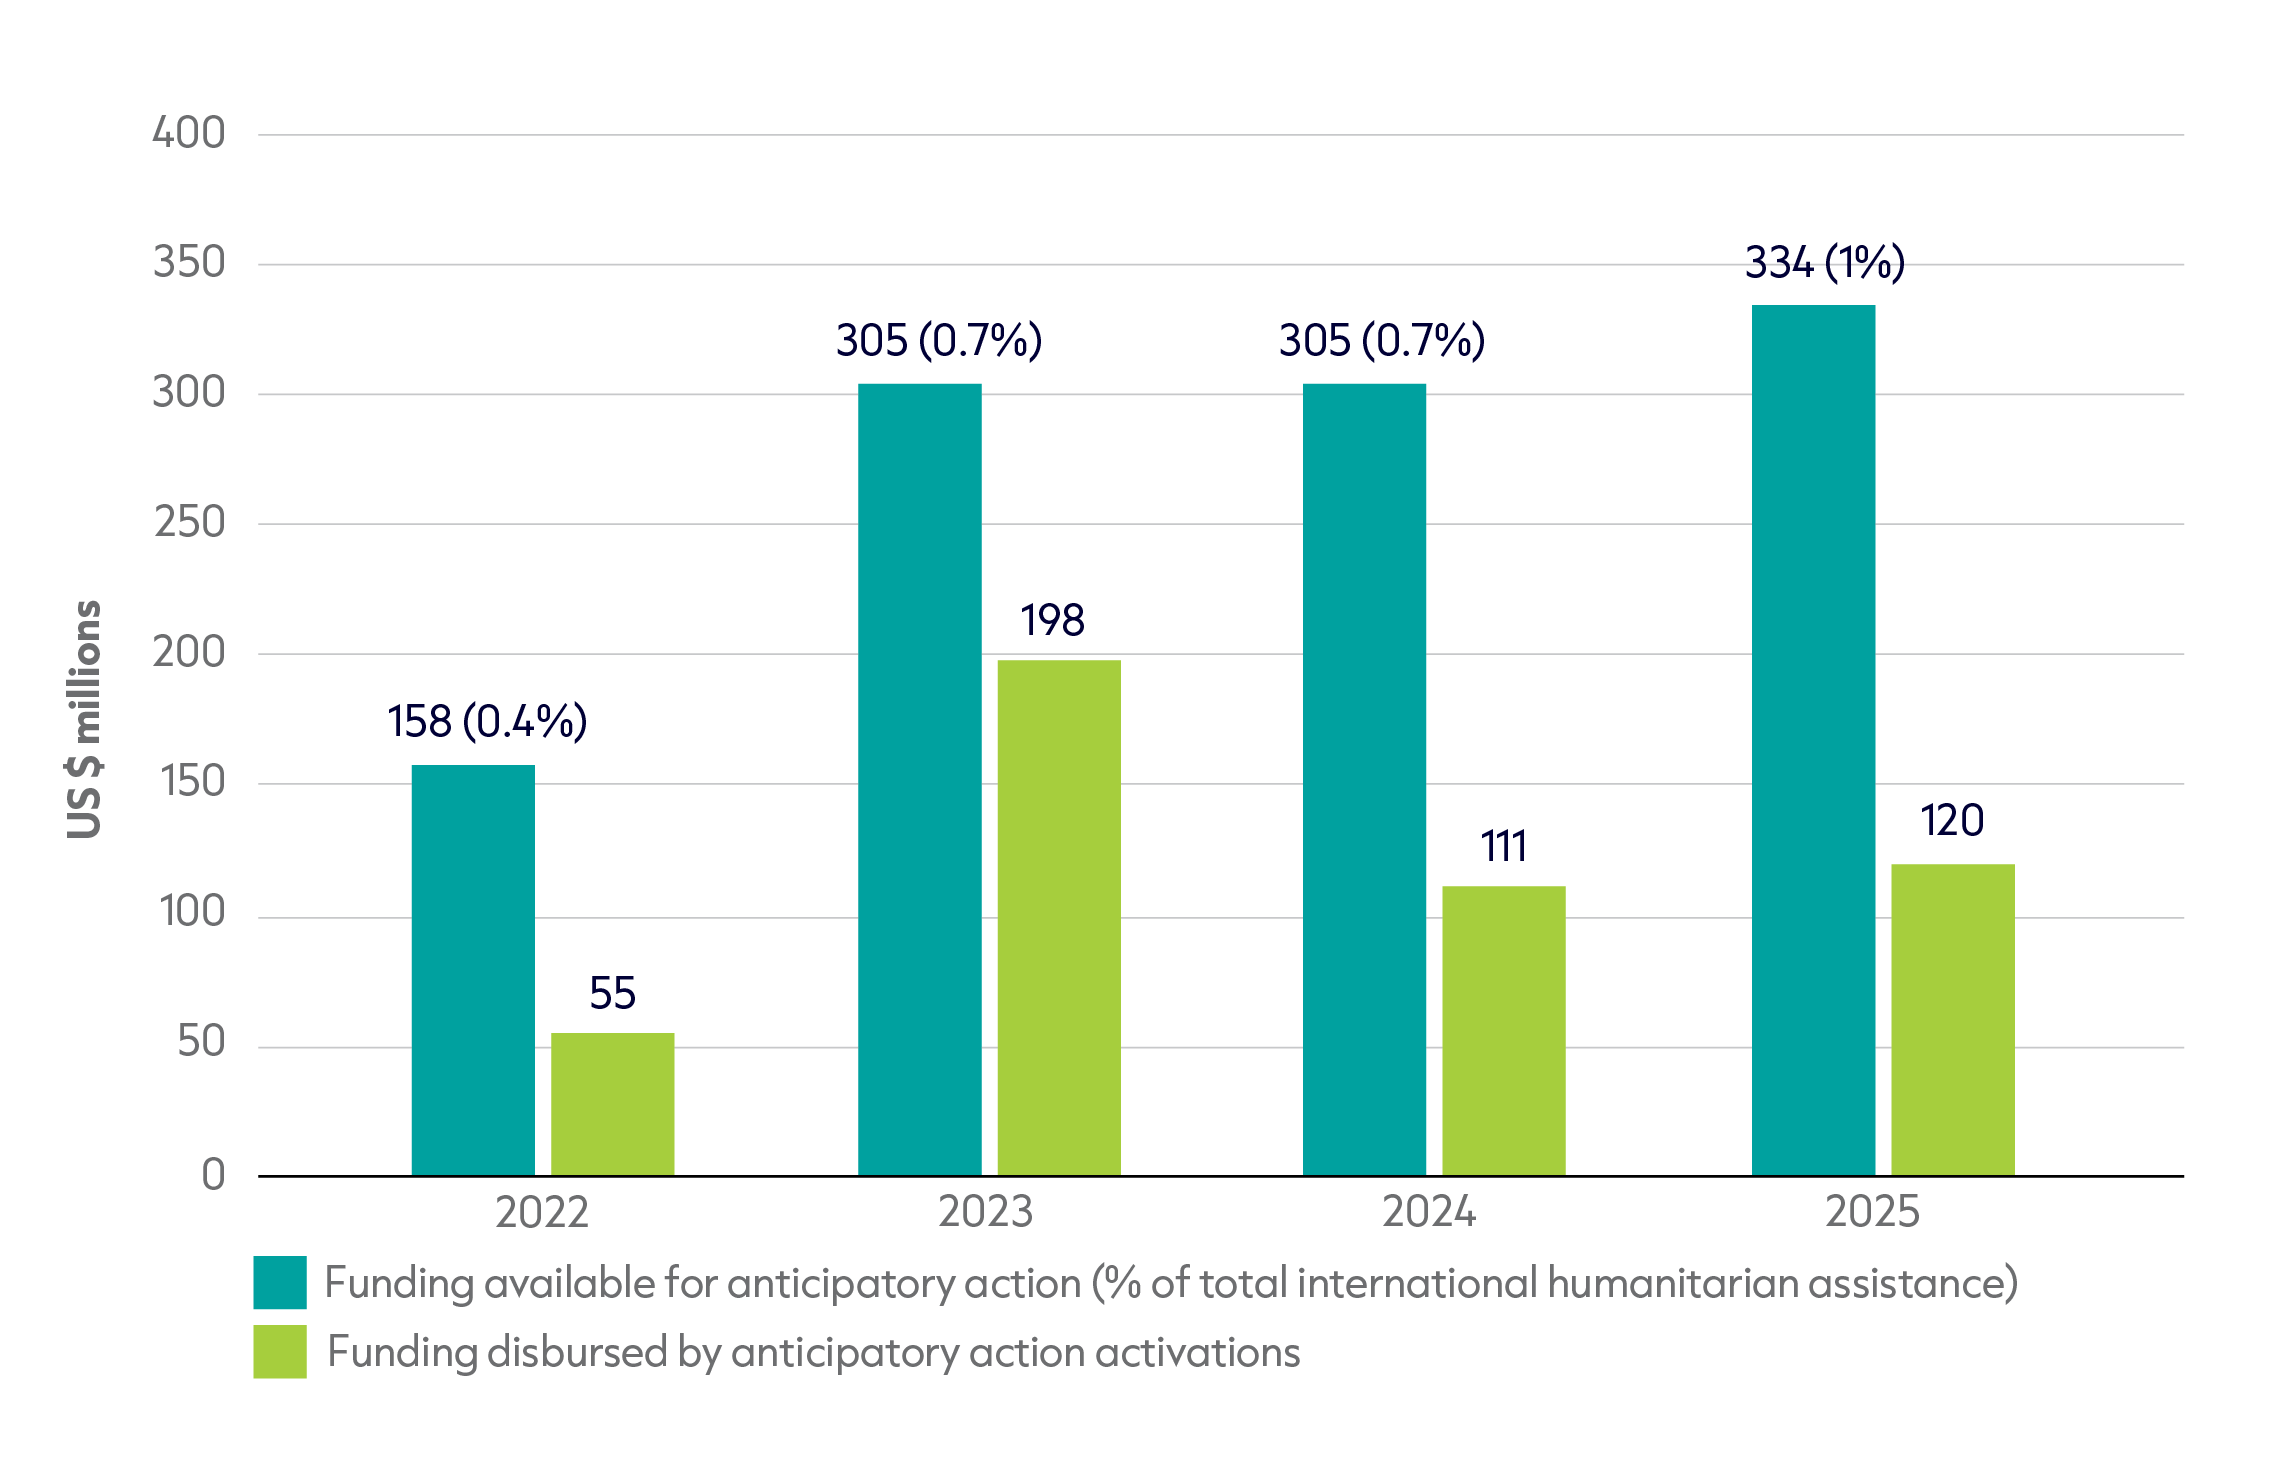
Figure 3.4: Funding available for anticipatory action reached 1% of total funding, a fifth of the Grand Bargain target for 2026
Total budget available for anticipatory action frameworks and disbursed through activations, and proportion of international humanitarian assistance, 2022–2025
Source: Based on Anticipation Hub data.
Notes: ALNAP adapted the Anticipation Hub dataset by including missing activations in the active frameworks data for any given year. Caps on the total amount available under UN OCHA-coordinated frameworks in specific contexts have been taken into account to avoid double counting. Additional funding for frameworks under development (but nevertheless available) have been included.
Anticipatory action is a form of pre-arranged financing that defines activities and trigger thresholds and is activated in the window between a shock warning and its impact. Given the rise in climatic shocks that are both forecastable and require a coordinated humanitarian response, the humanitarian system has made it a key priority to move towards this proactive and risk-informed mode of financing. The Grand Bargain has been one of the driving forces of efforts to increase the amount of anticipatory action financing available. In late 2024, the caucus to scale up anticipatory action culminated in a target for donors to substantially increase funding and set individual targets of 5% of humanitarian budgets for anticipatory action by 2026 or earlier, in line with the G7 commitments.[5] Progress was made over the past year as funding available grew by 10% and funding disbursed grew by 8%. As such, anticipatory action was protected from wider humanitarian system cuts but has yet to meet the 5% target despite widespread interest and support.
- The volume of funding made available for anticipatory action frameworks grew in 2025 to US $334 million, a 10% increase on the previous year (US $305 million in 2024).
- Against the backdrop of a sharply contracting overall international humanitarian assistance envelope, funding available for anticipatory action rose to 1% of total international humanitarian assistance in 2025, reaching the 1% threshold for the first time.
- Funding disbursed as a proportion of international humanitarian assistance remained stable in comparison to 2024, at 0.3%. It was 0.4% in 2023 and 0.1% in 2022.
The number of active anticipatory action frameworks, activations of frameworks and overall volumes disbursed all increased from 2024 to 2025.
- The number of active frameworks expanded sharply from 154 in 2024 to 262 in 2025, while the total budget available held broadly flat. This points to a continued shift towards establishing new frameworks rather than significantly expanding the resources channelled through each activation.
- Anticipatory action frameworks were active in 76 countries in 2025, up from 48 in 2024 – a sharp expansion in geographic coverage.
- The number of framework activations also increased to 146 activations in 2025 – up from 124 in 2024, 98 in 2023 and 47 in 2022.
- The overall volumes disbursed through these activations increased marginally from US $111 million in 2024 to US $120 million in 2025.
- Weather-related shocks (droughts, floods and tropical storms) accounted for 94% of both disbursed and available funding. Other frameworks accounted for air pollution, disease outbreaks, food insecurity and population movements.
The increase in the volume of anticipatory action equivalent to 1% of total international humanitarian assistance is encouraging, but it can be interpreted as a result of the broader contraction in humanitarian funding. Despite the overall growth in frameworks, activations and volumes of funding, resources disbursed per event have continued to decline, more than halving over the past two years, resulting in fewer per-event resources reaching more events. Furthermore, the majority of disbursed funding remained concentrated in a small number of countries.
- The average disbursement per activation has fallen dramatically from US $2 million in 2023 to US $893,000 in 2024 and US $821,000 in 2025.
- In 2025, just seven countries (Afghanistan, Ethiopia, Somalia, the Philippines, Mozambique, Nigeria and South Sudan) absorbed 66% of all funding disbursed through activations, similar to the 72% absorbed by the top seven countries in 2024.
The UN remained the largest coordinating body of anticipatory action frameworks.
- In 2025, 80% of total disbursed funding was channelled through UN-coordinated frameworks and 78% of available resources were from UN-coordinated frameworks (similar to 79% in 2024).
- This was followed by international NGOs (17% of disbursements and 10% of available resources), national governments and national NGOs (1% of disbursed funding) and the International Red Cross and Red Crescent Movement (2% of disbursed funding).
3.6: How have recent developments shaped OCHA-managed pooled funds?
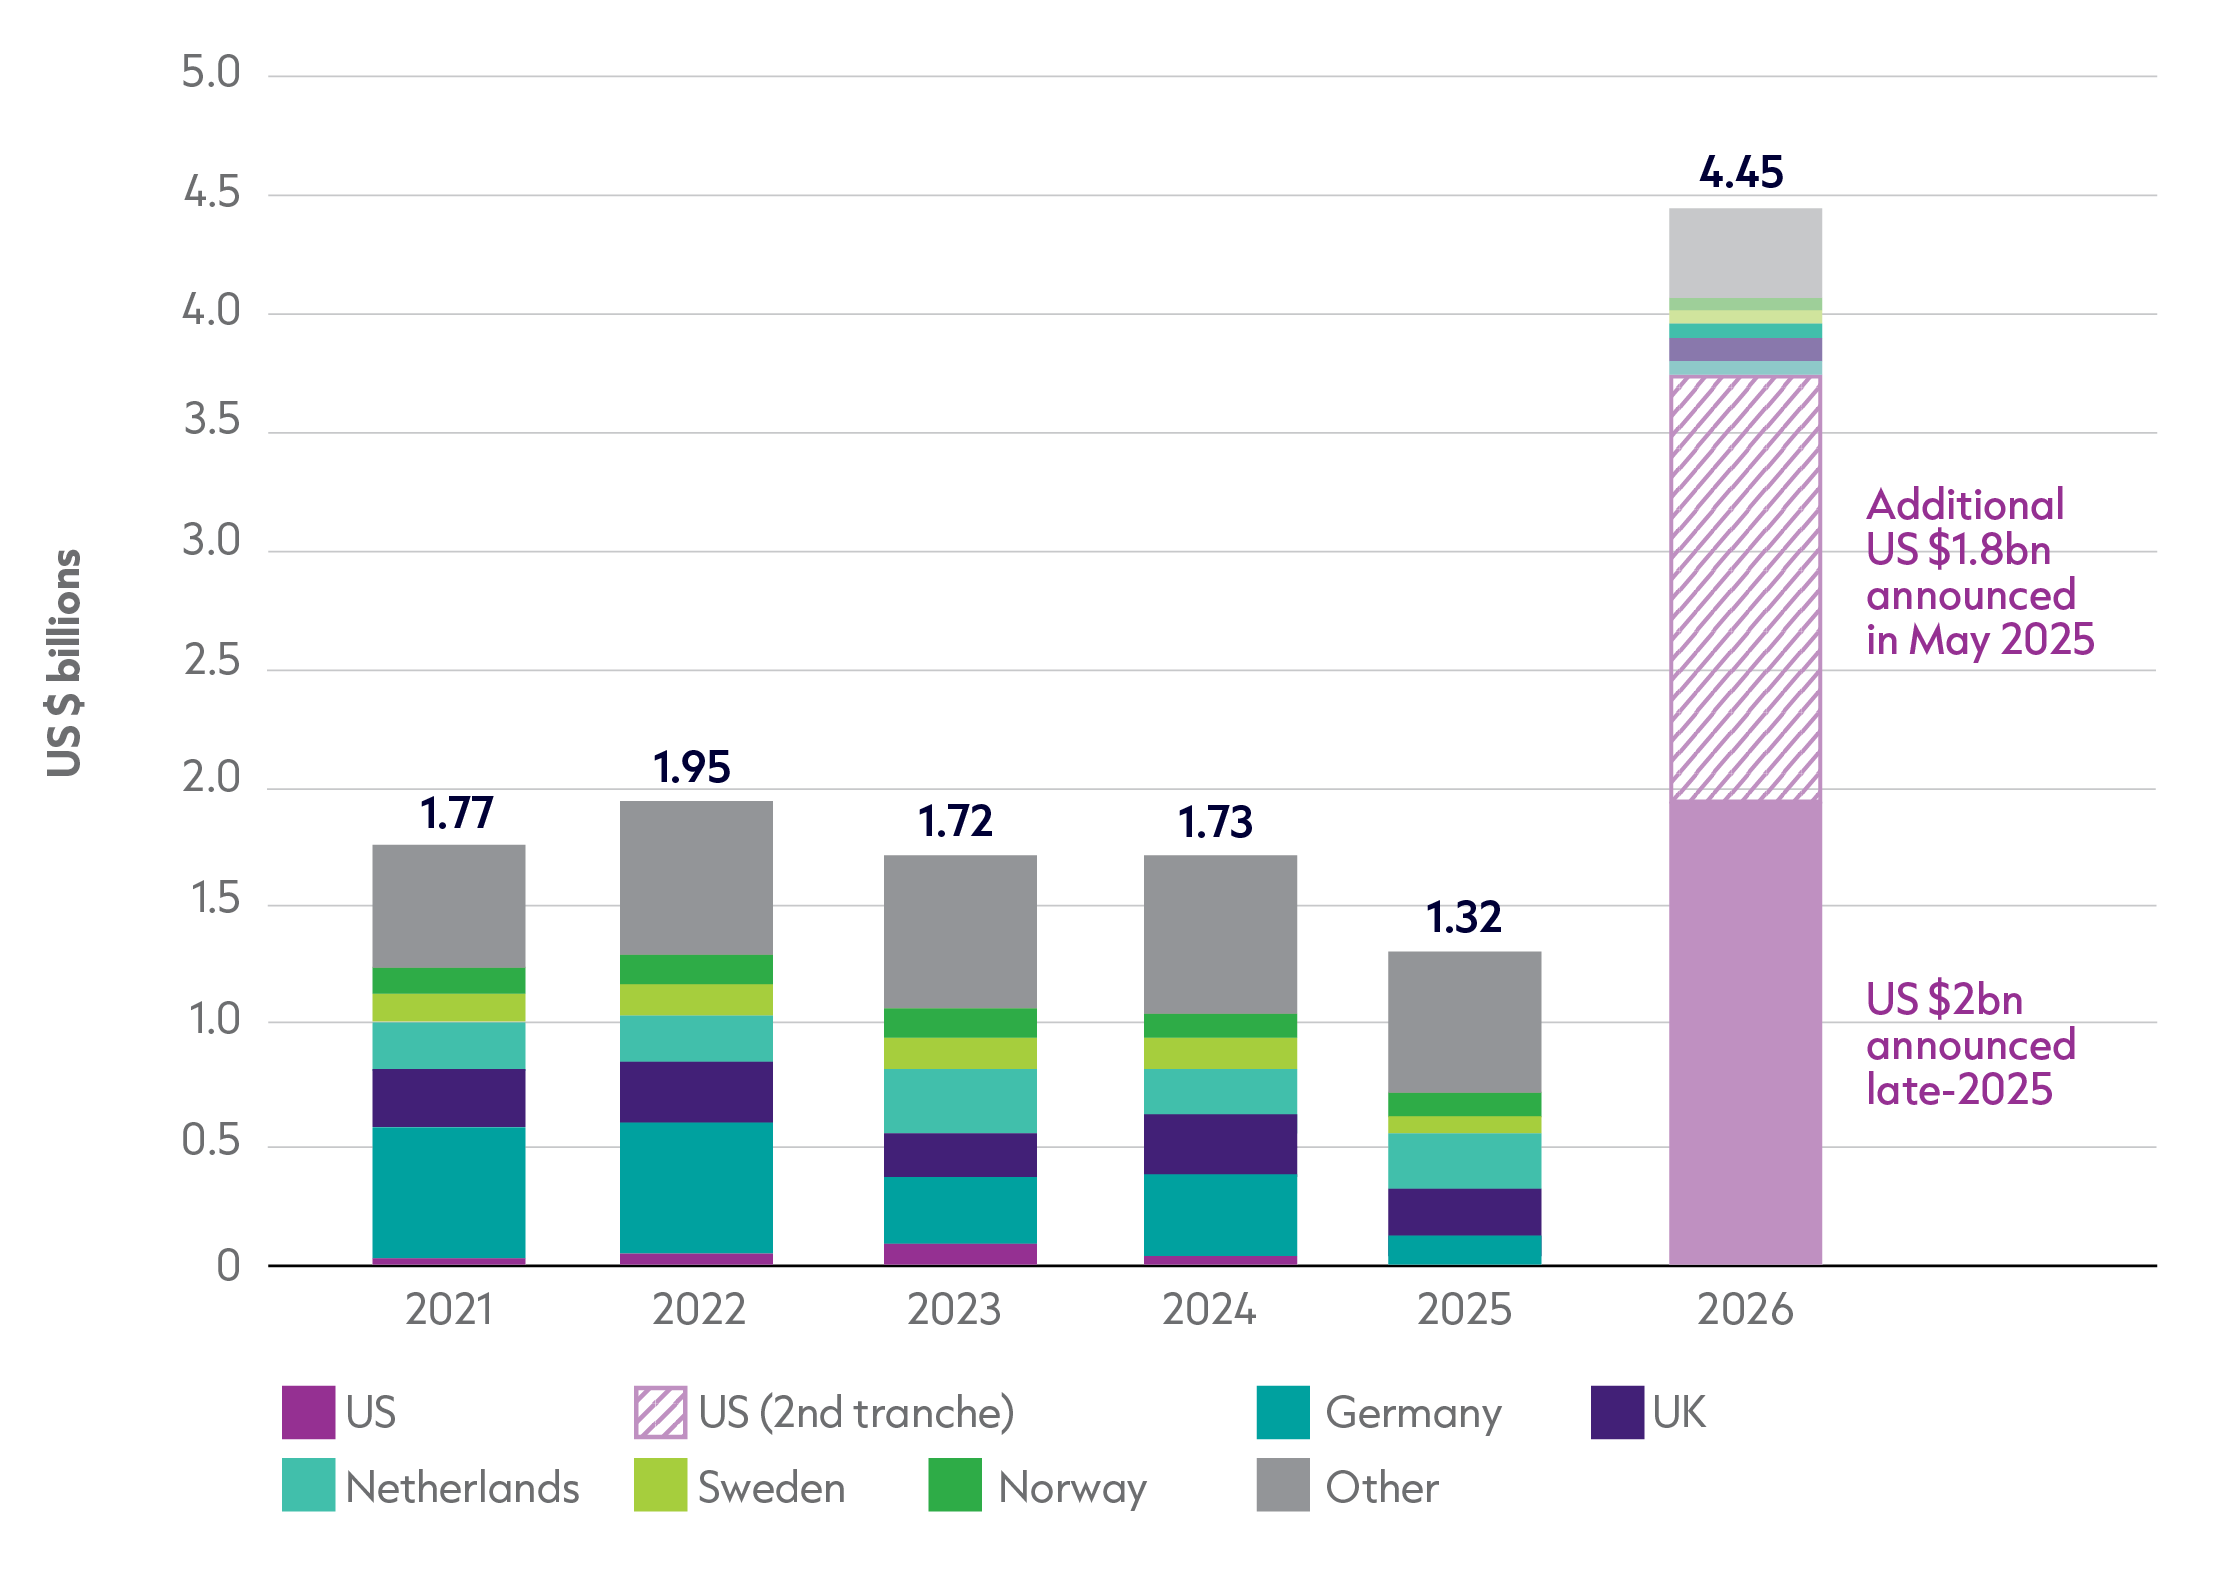
Figure 3.5: The US has contributed unprecedented volumes to OCHA-managed pooled funds in 2026
Source: UN OCHA CBPFs and Central Emergency Response Fund (CERF) data hubs.
Notes: Data is in current prices. Based on contributions data to UN-managed pooled funds. 2026 data is preliminary.
After the shutdown of the US Agency for International Development (USAID) and the major reductions in US humanitarian spending at the beginning of 2025, the US Department of State announced at the end of the year a US $2 billion contribution to UN-managed pooled funds for US-selected countries in 2026. This was followed in March 2026 by a pledge to provide an additional US $1.8 billion to be awarded in 2026.[6] This was up from zero contributions to pooled funds from the US in 2025. While the US has always been the humanitarian system’s largest donor, these announcements marked a seismic shift in how it channels funding through the system, away from the traditional mix of UN agencies and NGOs to channelling a large amount of its funding through OCHA via CBPFs and the Central Emergency Response Fund. This has resulted in the US dominating the pooled funds system, with disproportionate power over the mechanisms, selected countries and priorities, despite now being a smaller donor across the sector given its significant cuts in overall finance. In some countries, US funding represents the entirety of pooled funded resources. The contribution has also shifted the role of OCHA from system coordinator to donor, fund manager and gatekeeper.
Prior to the announcement, funding to UN-managed pooled funds was in decline. Funding in 2025 fell 23% compared to 2024 (a fall of US $406 million). This was largely driven by reduced funding from four of the five largest donors to pooled funds.
- Germany reduced funding most significantly in 2025, by 63% on the previous year, a fall of US $219 million.
- The UK and Sweden both reduced funding in 2025, by 21% (US $55 million) and 39% (US $49 million), respectively.
- The Netherlands was the only major donor to significantly increase funding to pooled funds – by 25% (US $47 million) compared to 2024.
As 2026 data is preliminary, it is unclear how other donors will react to this shift in the pooled fund landscape. However, the huge increase in funding from the US – which is currently 20 times greater than the previous highest volume of funding given (US $89 million in 2023) – is already having impacts on allocations to pooled funds. While OCHA has stipulated that there are no conditions restricting how this money is spent (beyond existing pooled fund rules), the US contribution in 2026 dwarfs OCHA’s own budget and enables significant US influence on spending priorities.
Historically, the UN-led country based pooled funds (CBPFs) have been among the first to increase funding allocations to local and national actors, meeting the Grand Bargain target of 25% back in 2018.[7] Furthermore, as an early proposal to respond to the sector-wide cuts in 2025, the Emergency Relief Coordinator briefly suggested an aspirational target of 70% of UN-led pooled funds specifically for local actors.[8] Recent ODI Global research on funding to local and national actors recommended that each CBPF should publish time-bound roadmaps on how to achieve the initial localisation target of 70%.[9] However, the injection of US funding and the subsequent significant allocations for UN agencies has led to a reversal in progress on funding to local and national actors.
- UN organisations have seen a huge increase in the volumes of funding allocated from pooled funds – reaching US $1.2 billion so far, up from less than US $61 million in the whole of 2025, a 19-fold increase already by May 2026.
- US funding is not being channelled via local or national actors, with only 7% allocated to national NGOs in 2026 so far, compared with almost 46% overall in 2025.
- This reverses a previously encouraging trend of increased funding from UN-coordinated pooled funds to national NGOs (35% in 2024, 46% in 2025, 7% so far in 2026).
In addition to the effects on localisation, US funding is having a huge impact on relative funding levels across crisis contexts by stipulating the crises it can be allocated to and by adding countries that did not previously have CBPFs or country windows under regional funds (e.g. Bangladesh, El Salvador, Guatemala, Honduras, Kenya and Uganda).
- Crisis contexts that have not received US funding in 2026 are: Afghanistan, Burkina Faso, Central African Republic (CAR), Lebanon, Mali, Niger, Palestine, Somalia, Venezuela and Yemen. The next tranche of funding is said to include CAR, Lebanon and Venezuela.
- At the same time in other contexts, such as Bangladesh, Colombia, Chad and Haiti, the US accounts for 100% of funding contributed to CBPFs so far this year – and thus these contexts have received far more funding.
- While this will likely shift slightly as other donors contribute more to pooled funds, pooled funds that have received US funding this year have so far received an average of 10 times more funding than those that have not.
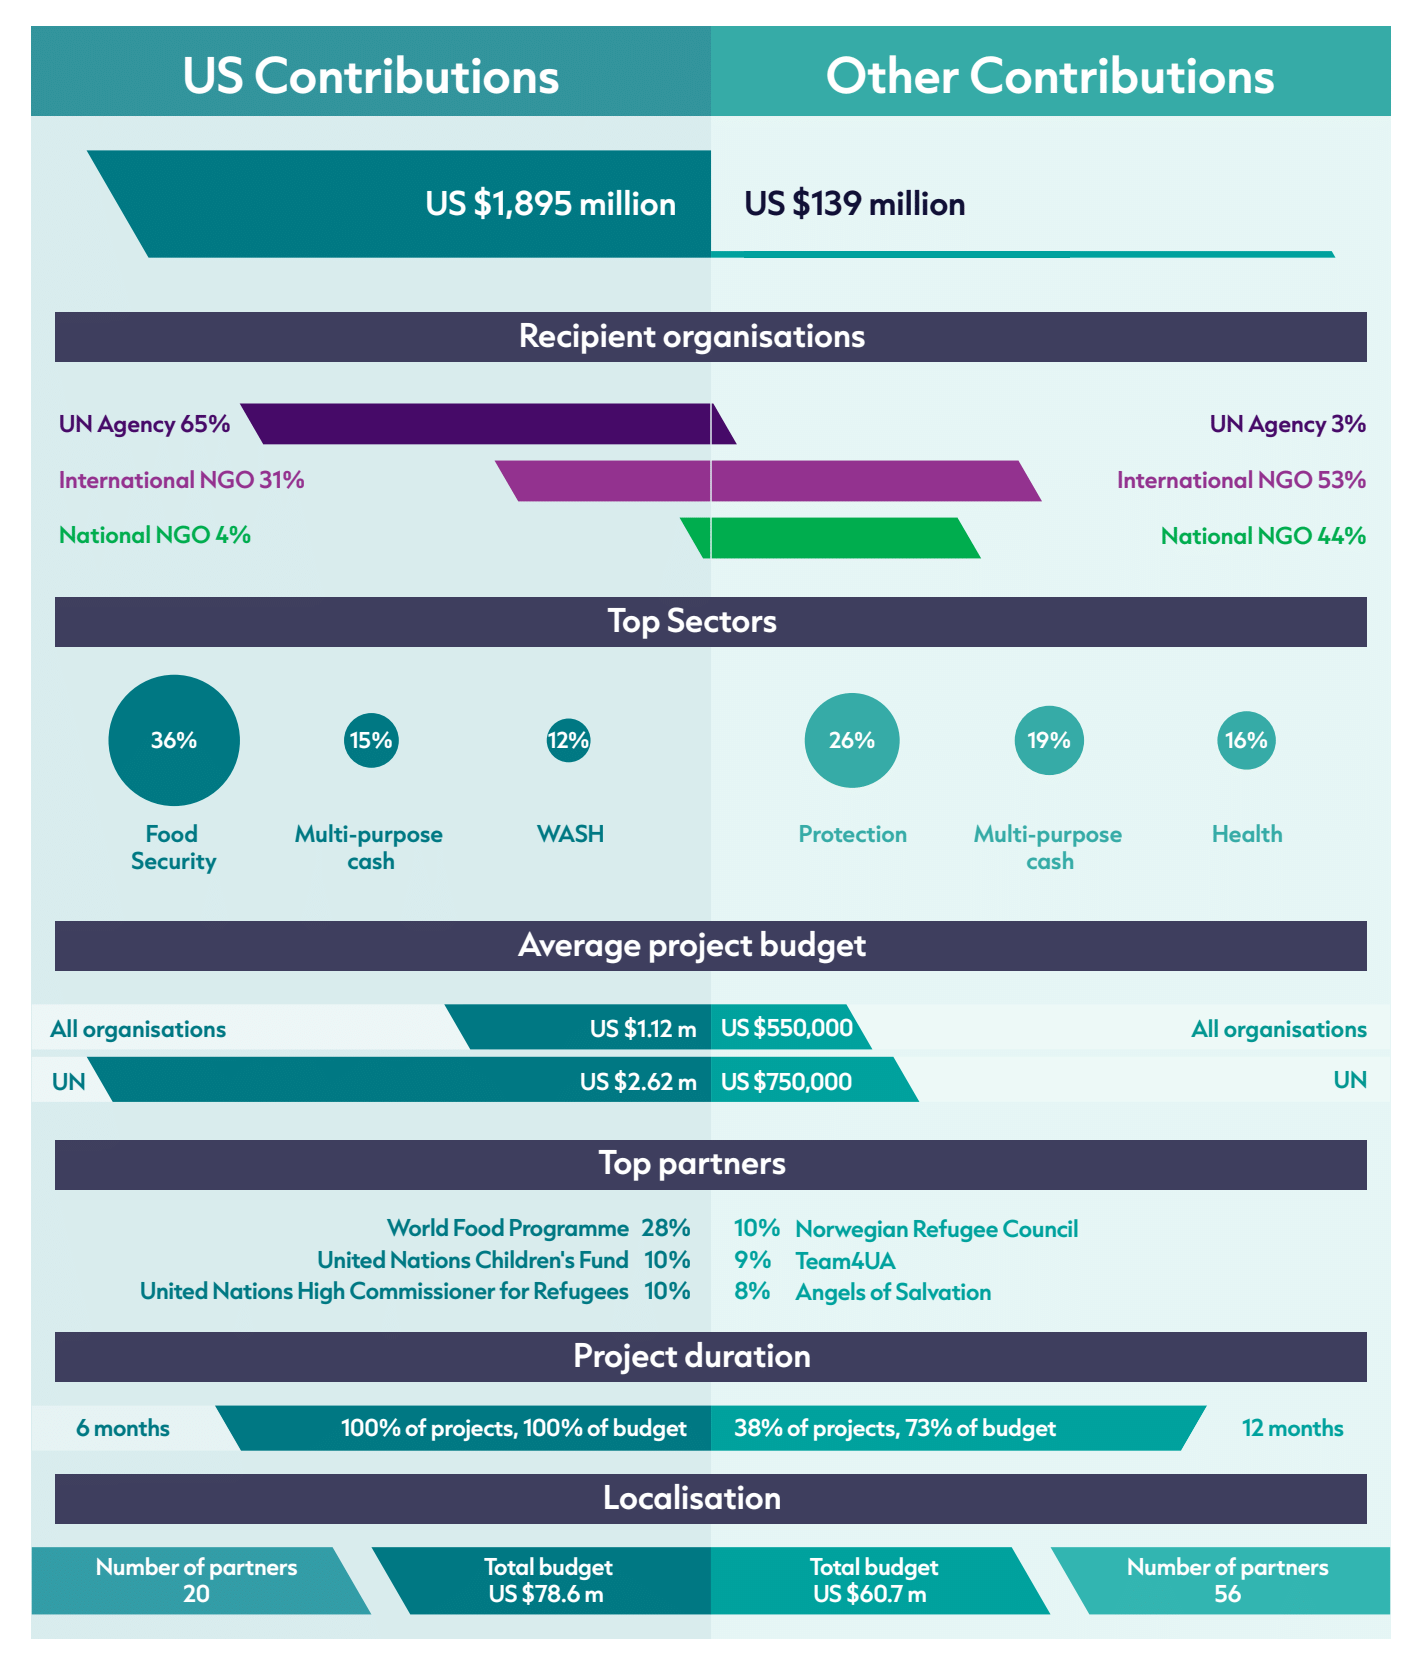
Figure 3.6 US-funded projects to CBPFs prioritise short-term UN-led projects with a strong focus on food
Source: ALNAP based on data from the UN OCHA CBPF Data Hub.
Notes: CBPF projects are categorised according to whether they are funded through US contributions or contributions from other donors. WASH = water, sanitation and hygiene.
While 2026 data is incomplete and should be viewed with caution, there are some preliminary trends in terms of how US funding is shaping UN-led pooled funds and creating two systems within one.
US funding reflects a preference towards funding UN agencies, which have greater capacities to absorb large funding volumes and deliver assistance in short timeframes. This is particularly relevant given that the first US funding announcement stipulated a six-month time limit for spending the money, although the second announcement has extended the deadline to 12 months. As a result, large agencies disproportionately received the funding, with local organisations missing out. There also have been reports of restrictive conditions on vetting, eligibility and information sharing, as well as early allocations for large agencies, which have all hampered smaller and local organisations from receiving funding.[10]
- US-funded projects are characterised by high budgets, a preference for UN agencies, and short implementation windows.
- US-funded projects only reached 20 local and national actors, compared with funding from all other donors, which reached 56.
- The New Humanitarian reported that a small number of international NGOs have received significant proportions of their programme budgets from pooled funds, and highlighted the disproportionate amounts allocated to Catholic Relief Services and World Vision (in comparison to their general funding levels), suggesting a tilt to US international NGOs.[11]
Thematic priorities and sectors funded by US contributions reflect a traditional focus on material and in-kind projects (e.g. Food Security and cash and voucher assistance). Humanitarian organisations are also concerned about the effect of the US’s Global Gag Rule, which targets not just reproductive health and abortion care, but also gender identity, diversity, equity and inclusion. It is unclear how its enforcement will affect organisations receiving funding from the pooled fund, although UN OCHA has said that no conditions have been placed on the funds.[12],[13]
- At the time of writing, funding to food security currently constitutes 36% of US-funded projects through pooled funds, compared to only 6% for non-US-funded projects.
- Multipurpose cash assistance is the second top cluster across both US- and non-US-funded pooled fund projects (15% for US, 19% for other donors), whilst shelter and non-food items allocations are broadly similar (11% for US, 14% for other donors), as are allocations to WASH (12% for US, 11% for other donors).
- Protection only accounts for 9% of funding allocated so far in 2026 for US-funded projects through pooled funds, compared to 26% for projects from other donors.
Allocations based on funding from other donors tend to reflect another approach: a stronger preference for NGOs for delivery, smaller budget allocations, and greater emphasis on channelling funding to local and national actors. The protection and health sectors are prioritised. However, current trends may shift, as significant increases are expected from other donors, which have already contributed US $167 million more in funding than has been allocated. Nevertheless, this analysis is based on a ‘US-funded projects dashboard’, which is in direct contradiction to the intention and spirit of pooled funds (in which separating out individual donor funding shouldn’t be possible).
Help us shape the GHA report!
We want to hear from you. Take this chance to share with us on The Global Humanitarian Assistance report 2026 survey.
Footnotes
-
This number does not directly align with the number reported under Figure 3.2 on funding direct to local and national actors, which is that 4.3% goes to local and national actors. This is due to methodological differences in the analysis: whereas Figure 3.1 looks at all trackable funding through public reporting systems (FTS), Figure 3.2 supplements this with data from other sources and thus uses a different denominator to align with UN budget totals. For the avoidance of doubt, 4.3% should be used as the figure for the percentage of funding going directly to local and national actors.
-
Pearson M. and Rieger N., 2026. The state of international humanitarian funding to local and national actors. ODI Global. Available at: https://alnap.org/help-library/resources/the-state-of-international-humanitarian-funding-to-local-and-national-actors/
-
CALP Network, 2026. Show Me the Money: Efficiency and Effectiveness in Humanitarian Response. Available at: https://www.calpnetwork.org/wp-content/uploads/2026/05/CALP-Network-Report-Show-Me-the-Money-Efficiency-and-Effectiveness-in-Humanitarian-Response.pdf
-
CALP Network, 2026. State of the World’s Cash 2026. Available at: https://www.calpnetwork.org/research-paper/state-of-the-worlds-cash-2026/
-
Inter-Agency Standing Committee, n.d. Grand Bargain Caucus on Scaling Up Anticipatory Action. Outcome document. Commitments. Available at: https://interagencystandingcommittee.org/sites/default/files/2024-12/GB%20AA%20-%20Final%20Caucus%20Outcome%20Document%20-%20New.pdf; ALNAP, 2025. Global Humanitarian Assistance Report 2025. Available at: https://alnap.org/help-library/resources/grand-bargain-caucus-scaling-up-anticipatory-action/
-
U.S. Department of State, 2026. United States Pledges Additional $1.8 Billion in Life-Saving Humanitarian Funding to OCHA’s Humanitarian Reset & Shares Powerful Results from the Trump Administration’s UN Humanitarian Reform Agreement. Office of the spokesperson, 14 May 2026. Available at: https://www.state.gov/releases/office-of-the-spokesperson/2026/05/united-states-pledges-additional-1-8-billion-in-life-saving-humanitarian-funding-to-ochas-humanitarian-reset-shares-powerful-results-from-the-trump-administrations-un-humanita
-
Pearson M. and Rieger N., 2026. The state of international humanitarian funding to local and national actors. ODI Global. Available at: https://alnap.org/help-library/resources/the-state-of-international-humanitarian-funding-to-local-and-national-actors/
-
Inter-Agency Standing Committee, 2025. Statement by Emergency Relief Coordinator Tom Fletcher - The Humanitarian Reset Phase Two. Available at: https://interagencystandingcommittee.org/inter-agency-standing-committee/statement-emergency-relief-coordinator-tom-fletcher-humanitarian-reset-phase-two
-
Pearson M. and Rieger N., 2026. The state of international humanitarian funding to local and national actors. ODI Global. Available at: https://alnap.org/help-library/resources/the-state-of-international-humanitarian-funding-to-local-and-national-actors/
-
Loy I., 2026. Inklings | Save the Children and the elephant in the pool. The New Humanitarian, 1 April 2026. Available at: https://www.thenewhumanitarian.org/newsletter/2026/04/01/inklings-save-children-and-elephant-pool
-
Loy I., 2026. Inklings | Save the Children and the elephant in the pool. The New Humanitarian, 1 April 2026. Available at: https://www.thenewhumanitarian.org/newsletter/2026/04/01/inklings-save-children-and-elephant-pool
-
Loy I., 2026. Inklings | Humanitarians’ global gag dilemma. The New Humanitarian, 5 February 2026. Available at: https://www.thenewhumanitarian.org/newsletter/2026/02/05/inklings-humanitarians-global-gag-dilemma; The International PRIDE Centre, 2026. Statement: US Global Gag Rule & Principled Humanitarian Aid. Available at: https://pridecentre.org/wp-content/uploads/2026/01/260123-US-GAG-Rule-Expansion-final.pdf; Human Rights Watch, 2026. US: New, Sweeping Foreign Aid Rules Undermine Global Rights. Available at: https://www.hrw.org/news/2026/01/27/us-new-sweeping-foreign-aid-rules-undermine-global-rights
-
Miolene E., 2026. New US humanitarian funds shielded from expanded Mexico City Policy. Devex, 19 May 2026. Available at: https://www.devex.com/news/new-us-humanitarian-funds-shielded-from-expanded-mexico-city-policy-112527