Infographic: Top donors 2026
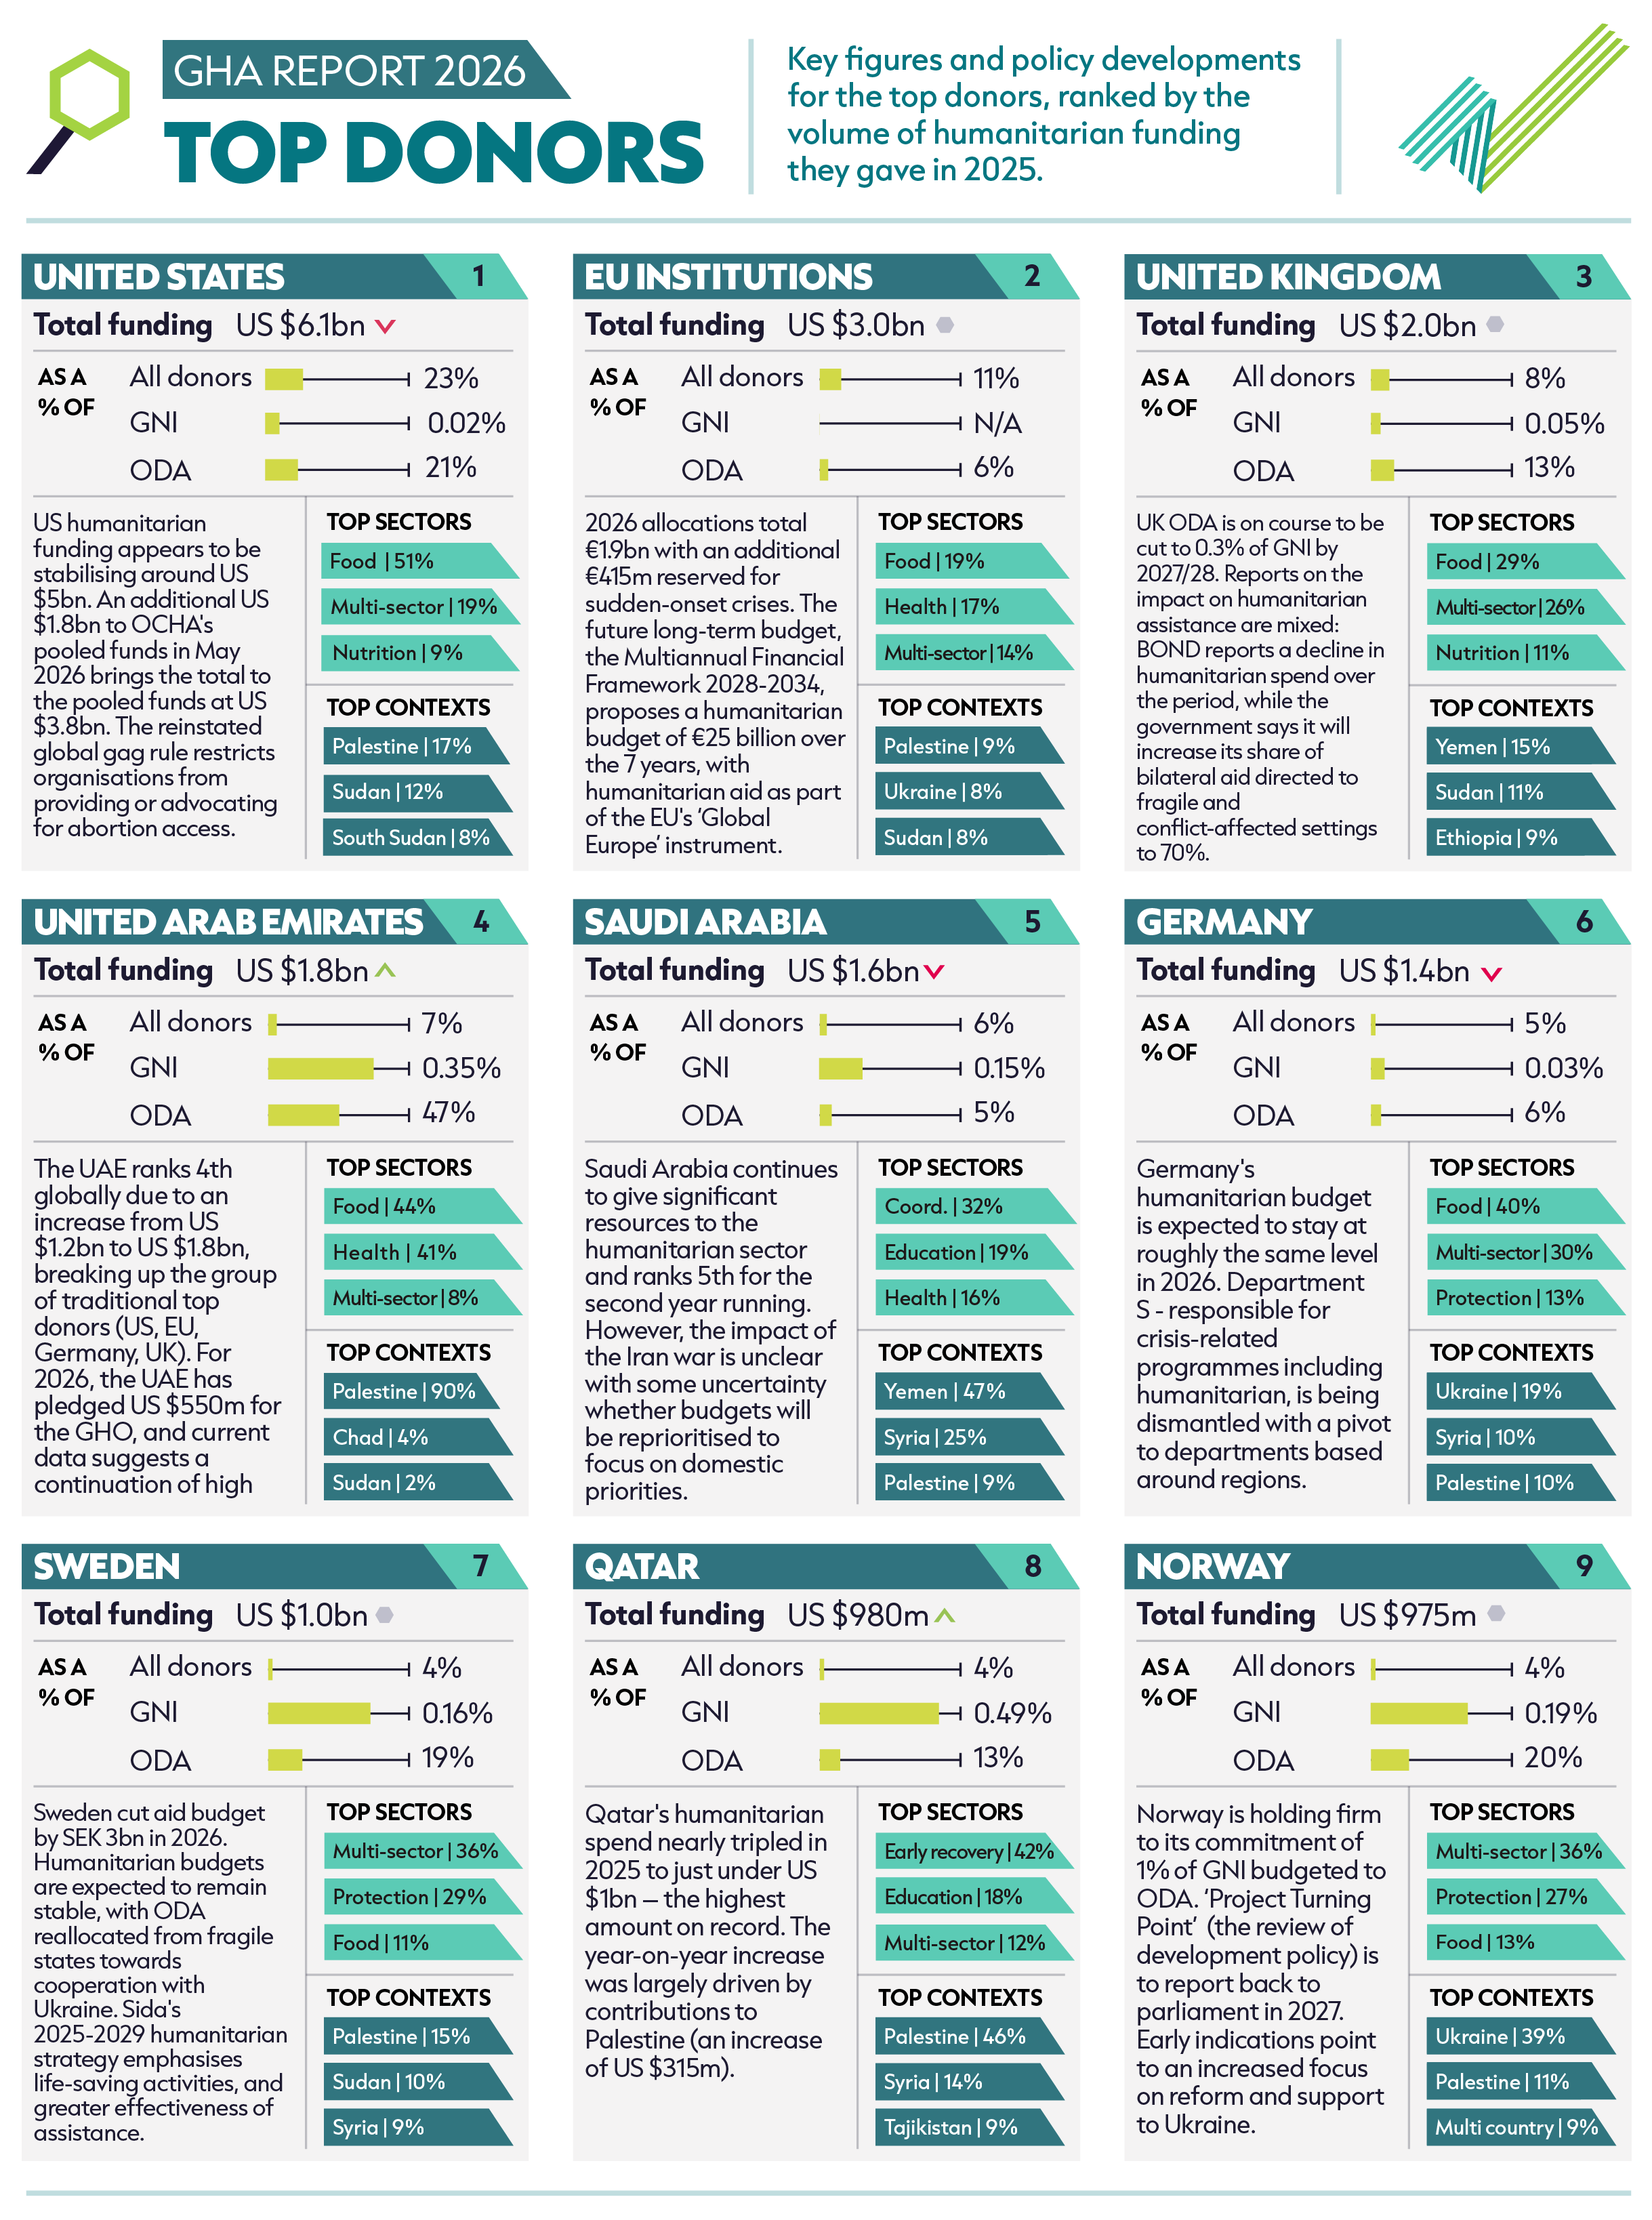
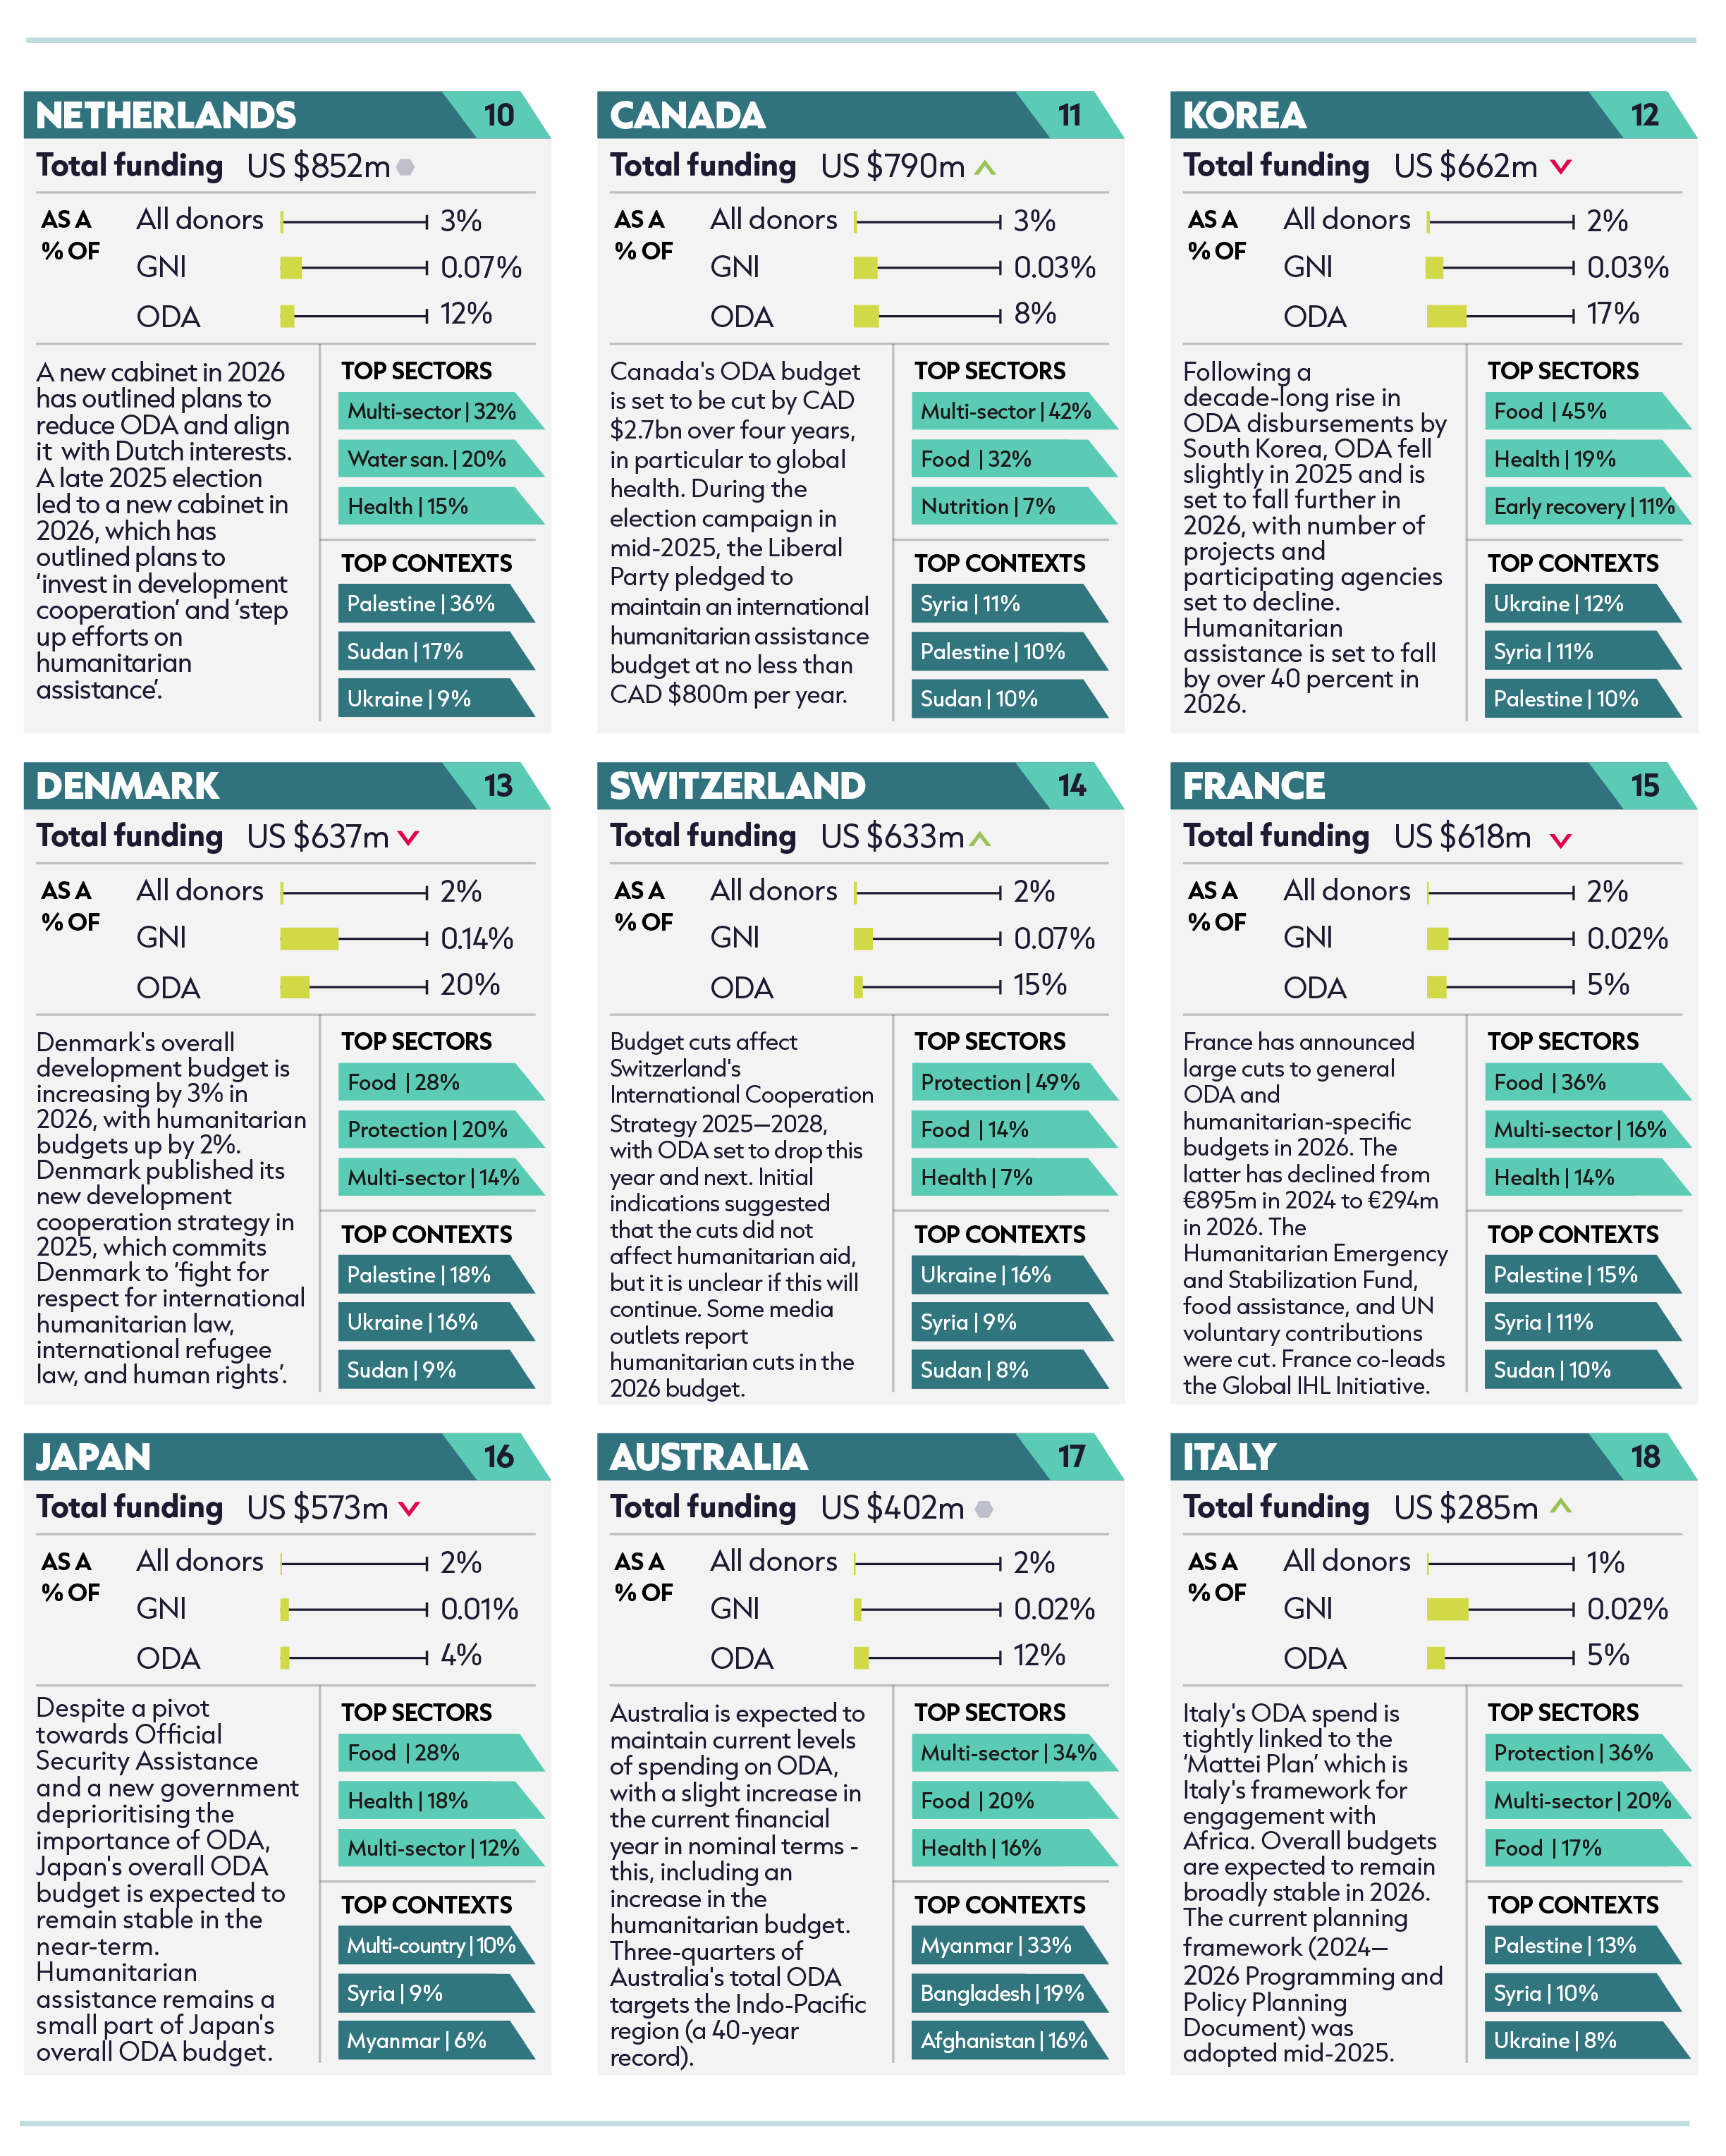
Sources: Organisation for Economic Co-operation and Development (OECD) Development Assistance Committee (DAC) and UN Office for the Coordination of Humanitarian Affairs (OCHA) Financial Tracking Service (FTS) Notes: Figures for total funding from donors are for 2025, expressed in 2024 constant prices to align with other analyses in the report. These figures exclude imputed EU contributions to humanitarian assistance. Likewise, the percentage of all public donors pertains to donor totals excluding EU imputations, and public funding only. Spend as a percentage of 2025 GNI data taken from the OECD DAC latest preliminary data as released in April 2026. GNI comparisons for Saudi Arabia are based on 2024 data due to a lack of DAC preliminary data for 2025. Spend as a percentage of ODA uses the same OECD DAC preliminary data release. Spend as a percentage of ODA figures for Saudi Arabia, Qatar and the UAE uses 2024 data due to a lack of 2025 data; both numerator and denominator are from the OECD DAC. Data for top sectors and top contexts are taken from FTS with data extracted in April 2025. Multiple sectors, multi-sector, and multipurpose cash have been combined into one category. Multi-sector often refers to multisectoral assistance provided by UNHCR for refugee settings. Agriculture has been combined with food security. Top contexts excludes funding to 'global' projects or unspecified locations, but includes funding to multiple countries. Published by ALNAP as part of the Global Humanitarian Assistance Report 2026.