The changing donor landscape
1.1: Summary
1.2: How much funding did the humanitarian system lose in 2025?
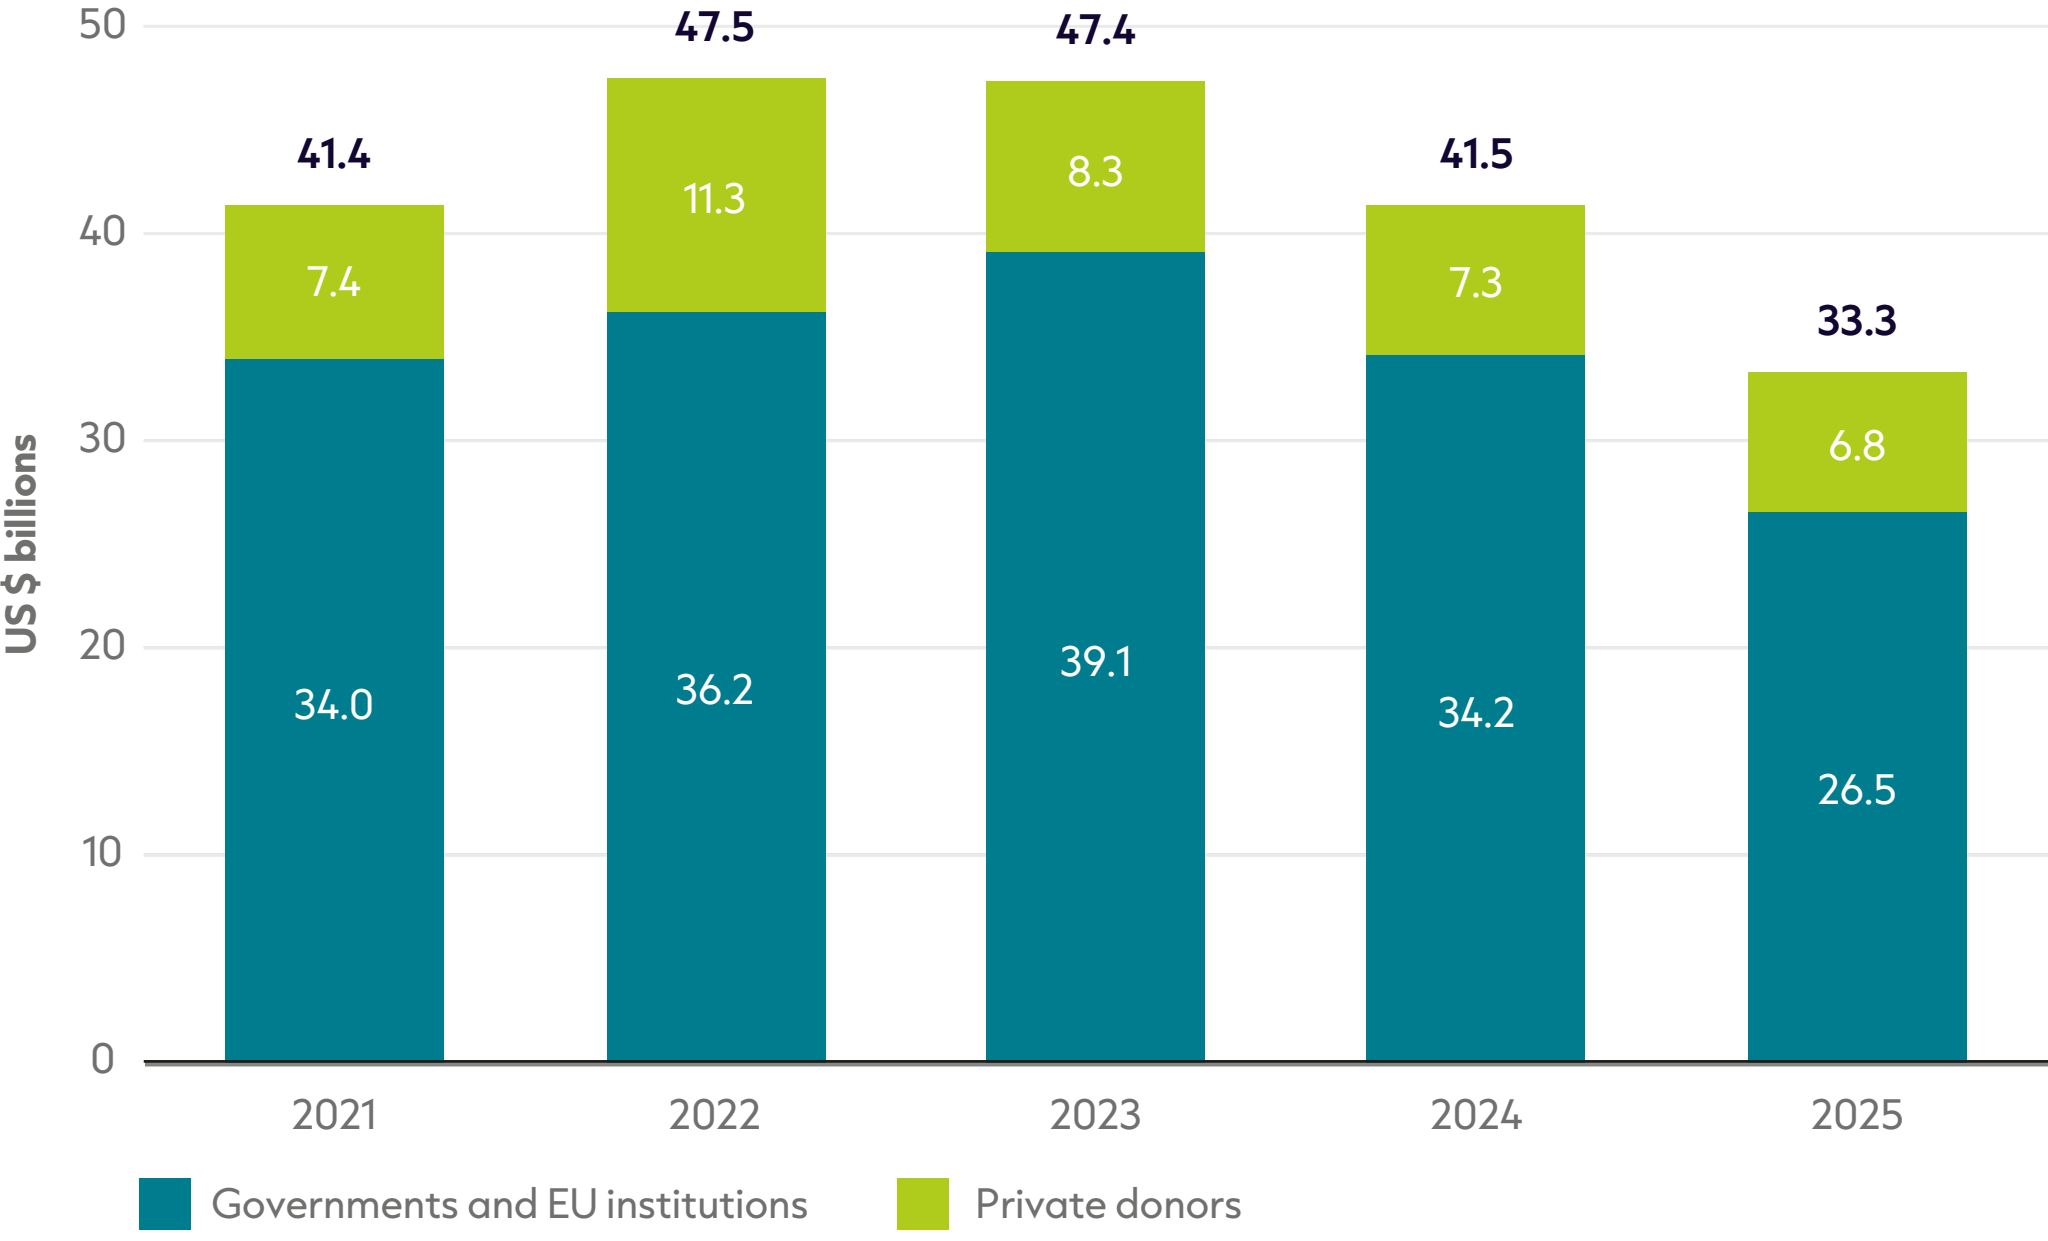
Figure 1.1: Humanitarian funding fell for the third year in a row, with a 20% drop in 2025
Total international humanitarian assistance, 2021–2025
Source: ALNAP based on Organisation for Economic Co-operation and Development (OECD) Development Assistance Committee (DAC), UN Office for the Coordination of Humanitarian Affairs (OCHA) Financial Tracking Service (FTS), UN Central Emergency Response Fund (CERF) and our unique dataset for private contributions.
Notes: Figures for 2025 are preliminary. Totals for previous years differ from those reported in previous GHA reports due to updated deflators and data. Data is in constant 2024 prices. The methodology used to produce total international humanitarian assistance is detailed in the ‘Methodology and definitions’ chapter (online).
Primarily due to funding cuts from major humanitarian donors, the humanitarian system contracted by 20% in 2025 to US $33.3 billion. This is the third year in a row that the sector has shrunk, and the largest fall in recent years. The reduction is a consequence of both reductions in funding from public donors (e.g. governments and EU institutions) and private donors (e.g. individuals, corporates and foundations).
As a result, the humanitarian system as a whole now receives as much funding as it did in 2017. However, humanitarian needs have changed substantially: in 2017, 141 million people were in need of humanitarian assistance compared with 300 million people at the end of 2025. The fall in recent years is unprecedented, with the sector now receiving 30% less than it did at its peak in 2022 – in absolute terms this is US $14.1 billion.
This reduction in humanitarian funding is devastating for the ability of humanitarian responses to provide assistance to the millions of people facing some of the world’s worst disasters and conflicts. As a reference to highlight how reductions in activity by around a third can have severe and lasting impacts, the US economy shrunk by 29% during the Great Depression, whilst the Ukrainian economy shrunk by 29% in 2022.[1]
However, the contraction in funding is far short of the claim that “global humanitarian funding has shrunk by 50%” from the International Rescue Committee in December 2025, or that “the humanitarian sector has contracted to just one-third of its size from 10 months ago” from Tom Fletcher, the Emergency Relief Coordinator in September 2025.[2]
Public funding for international humanitarian assistance has been hit by large funding cuts from key donors in 2025, notably the US and Germany:
- Public funding for international humanitarian assistance fell by 22% in one year, and by 32% over two years.
- Funding from the US fell from US $13.5 billion in 2024 to US $6.1 billion in 2025, whilst funding from Germany fell from US $2.3 billion to US $1.5 billion.
- The continuing fall in humanitarian assistance comes after the peak in 2022 when the escalation of the war in Ukraine drove higher humanitarian contributions.
- Historical figures have been revised slightly upwards due to increased reporting of funding for previous years from some donors (Qatar, Saudi Arabia and the UAE).
Private funding has been an increasing focus of attention for the humanitarian system – with dwindling budgets from the public sector and governments, aid agencies are looking to the private sector, such as philanthropies and foundations, to fill the funding gap left by governments. However, data shows that private funding to the humanitarian system fell for the third year in a row:
- Private donors gave an estimated US $6.8 billion in funding in 2025, down from US $7.3 billion in 2024, and the US $11.3 billion in 2022 when the conflict in Ukraine boosted private giving.
- Private funding has decreased to levels not seen since 2021, though not by the same magnitude as public funding; public funding fell by 22% in 2025, compared with a 7% decline for private funding.
- Private funding has decreased to just above the pre-Ukraine average – between 2016 and 2021, private funding stood at just over US $6 billion per year.
The budget cuts by donors in recent years has led to a humanitarian ‘great depression’. However, it is not clear what the future trajectory of funding is for the humanitarian system: will there be a recovery in an ‘V shape’ or a ‘U shape’, will the sector flatline in an ‘L shape’ and not recover to previous heights, or will the sector’s funding fail to stabilise and keep falling?
1.3: Scenarios for 2026: how much could public humanitarian funding fall this year?
Through examining publicly available information from donor governments, two scenarios have been constructed to show the trajectory of humanitarian funding in 2026. The scenarios presented are speculative and based on a degree of uncertainty, as donor disbursements rarely match initial budgets. This may reflect several factors, including reallocations or additional disbursements during the year, initial pledges not being approved in finance bills, disbursements being made late and rolling into the next financial year, and limited visibility of humanitarian budgets within broader budget lines, which makes it difficult to determine what is actually allocated in the first instance.
Therefore, these scenarios should be considered speculative. Readers should use these – and any other projections offered by others – with caution and to complement other data in their strategic planning. For details on how these projections were constructed and their assumptions, see the ‘Methodology and definitions’ chapter.
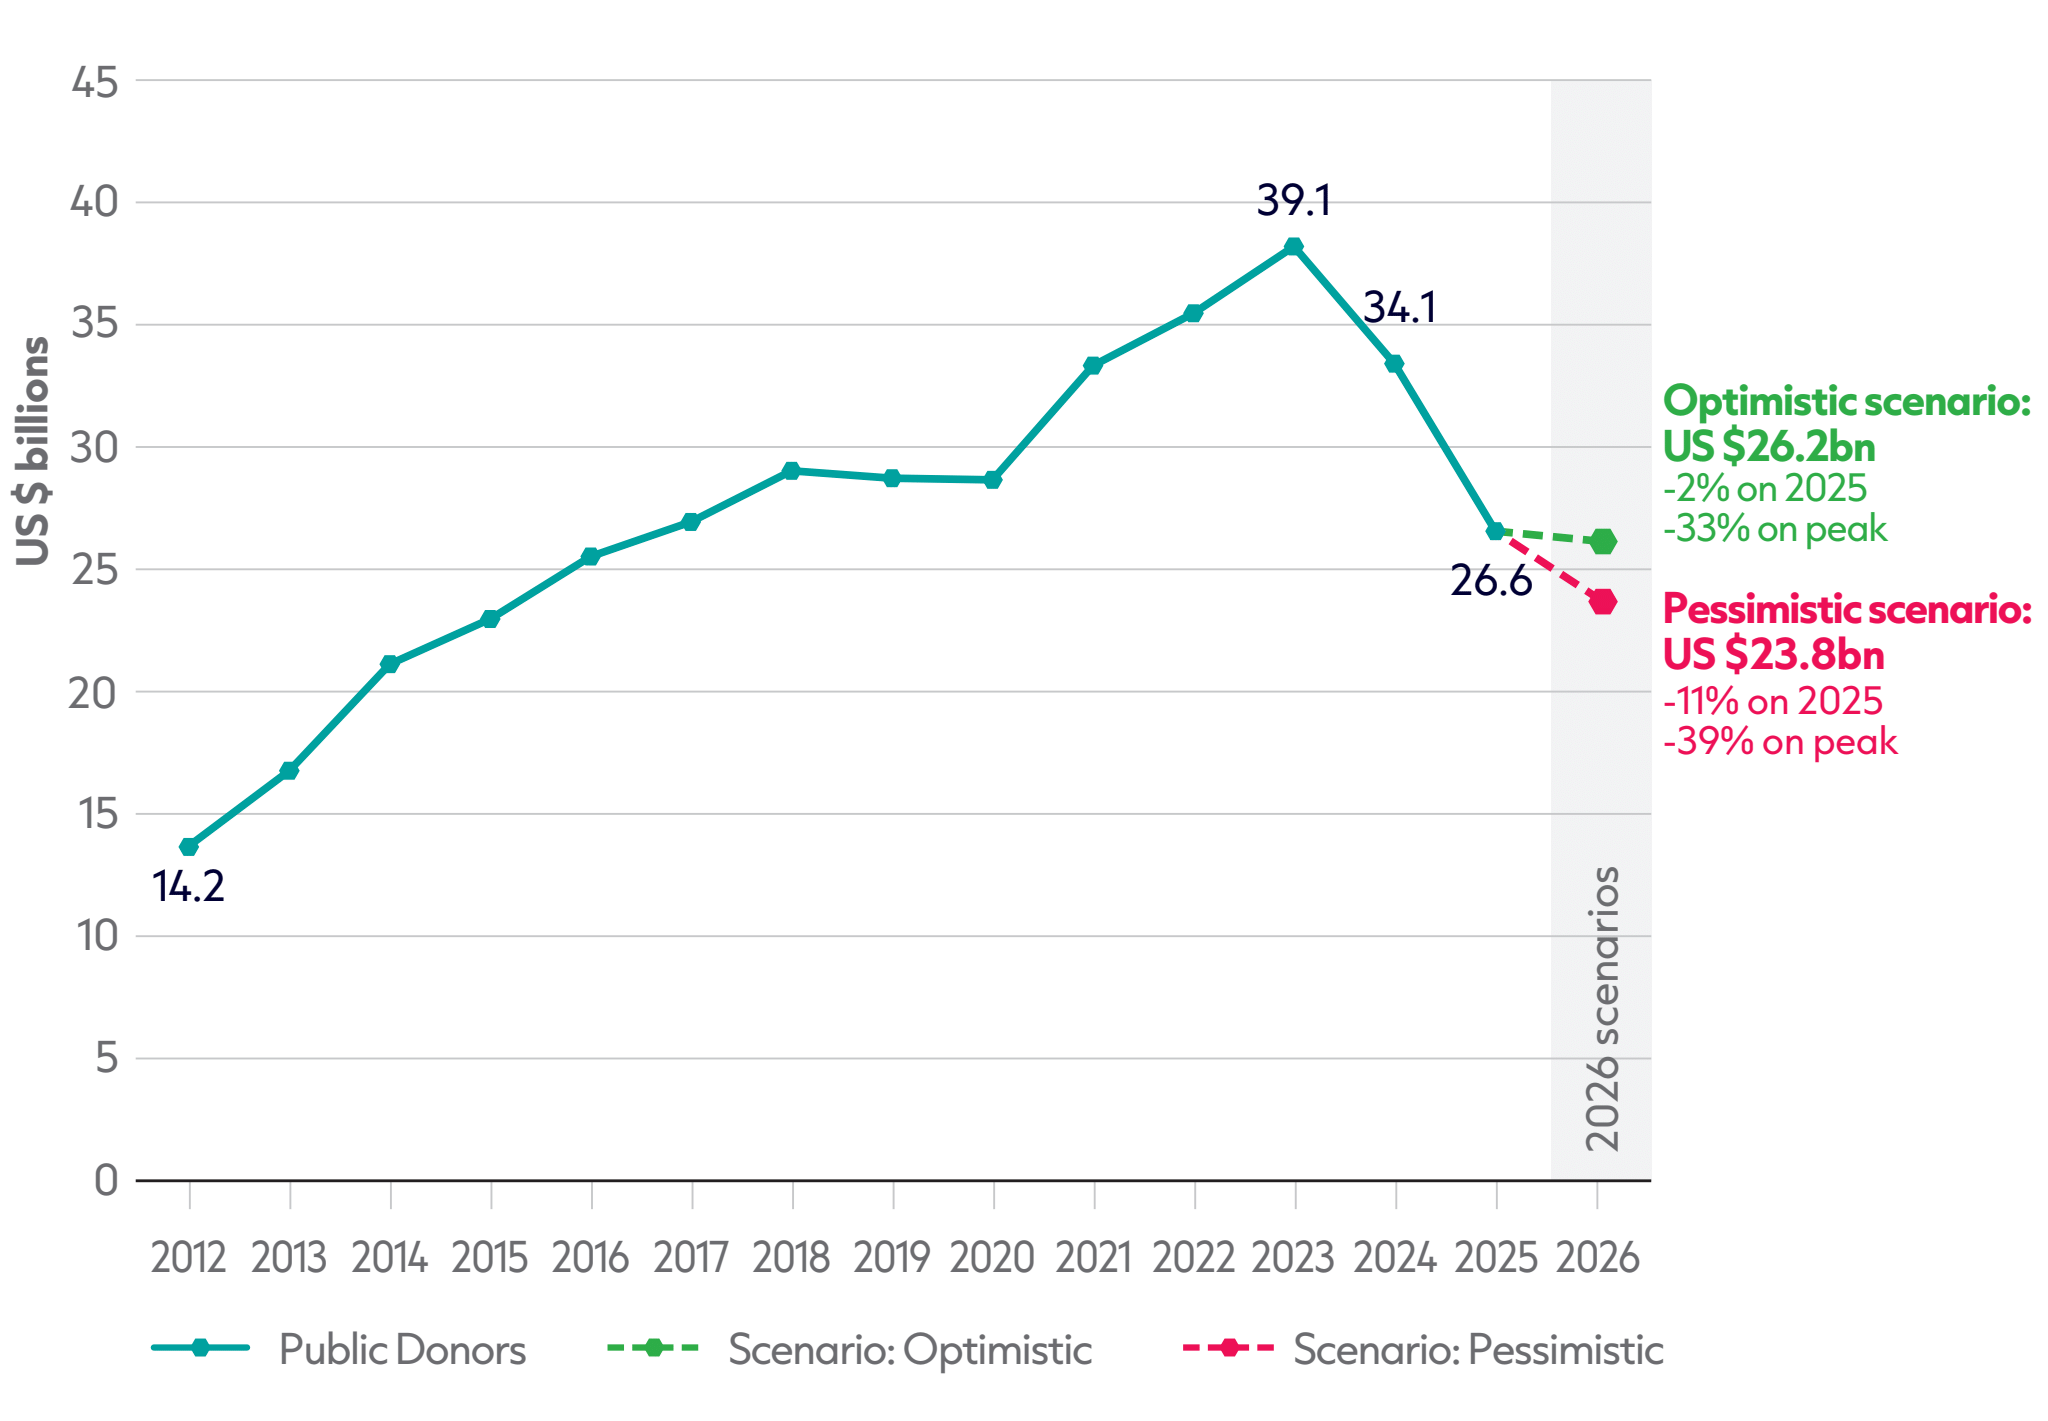
Two scenarios for humanitarian funding from public donors, 2026
Source: Historic data based on OECD DAC, UN OCHA FTS and UN CERF. 2026 scenarios based on publicly available information regarding ODA or humanitarian budgets.
Notes: 2025 data is preliminary. Data is in constant 2024 prices. ‘Public donors’ refers to governments and EU institutions. Historical figures differ from those reported in the GHA Report 2025 due to updated final reported international humanitarian assistance data and a different year for constant prices. Methodological notes on how the 2026 scenarios were constructed are detailed in the ‘Methodology and definitions’ chapter.
Both scenarios show a drop in public humanitarian funding in 2026, albeit by differing amounts:
- The optimistic scenario shows a decline by 2% on 2025, equivalent to a reduction of US $450 million. Taking a medium-term perspective, this would mean that the public humanitarian funding is 33% smaller than its peak in 2023.
- The pessimistic scenario shows a larger decline of 11% on 2025, equivalent to a reduction of US $3 billion. This would equal a 39% reduction on the peak of public funding in 2023.
Both scenarios reflect a humanitarian system that may be reaching the trough of its current decline. In the first year of the decline in public funding (2024) funding declined by 13%, before cuts accelerated in the second year (2025) and public funding declined by 22%. Both scenarios suggest that the cuts are likely to continue but will decelerate.
The primary reason for the future deceleration of cuts is that US funding has already fallen a large amount. As noted in the next section, the US cut funding by US $7.4 billion in a single year, declining to US $6.1 billion – this fall in magnitude won’t happen again in 2026 with US funding projected to stabilise. In FY26, the US has made US $5.5 billion available for humanitarian assistance, whilst current FY27 proposals from the Administration and Congress range between US $4.5 billion and US $5.1 billion.[3]
However, despite the deceleration, there is still uncertainty in the projections. This is partly due to ambiguity over how US funding will materialise in FY27 and the difficulties in aligning financial year and calendar years. There is also a lack of forward-looking budgetary information from Gulf donors as they do not publish planned funding strategies but tend to allocate pledges on an ad-hoc basis. This is compounded with uncertainty in light of the Iran war and whether their budgets will be reallocated towards domestic priorities.
1.4: Which donors contributed the most in 2025?
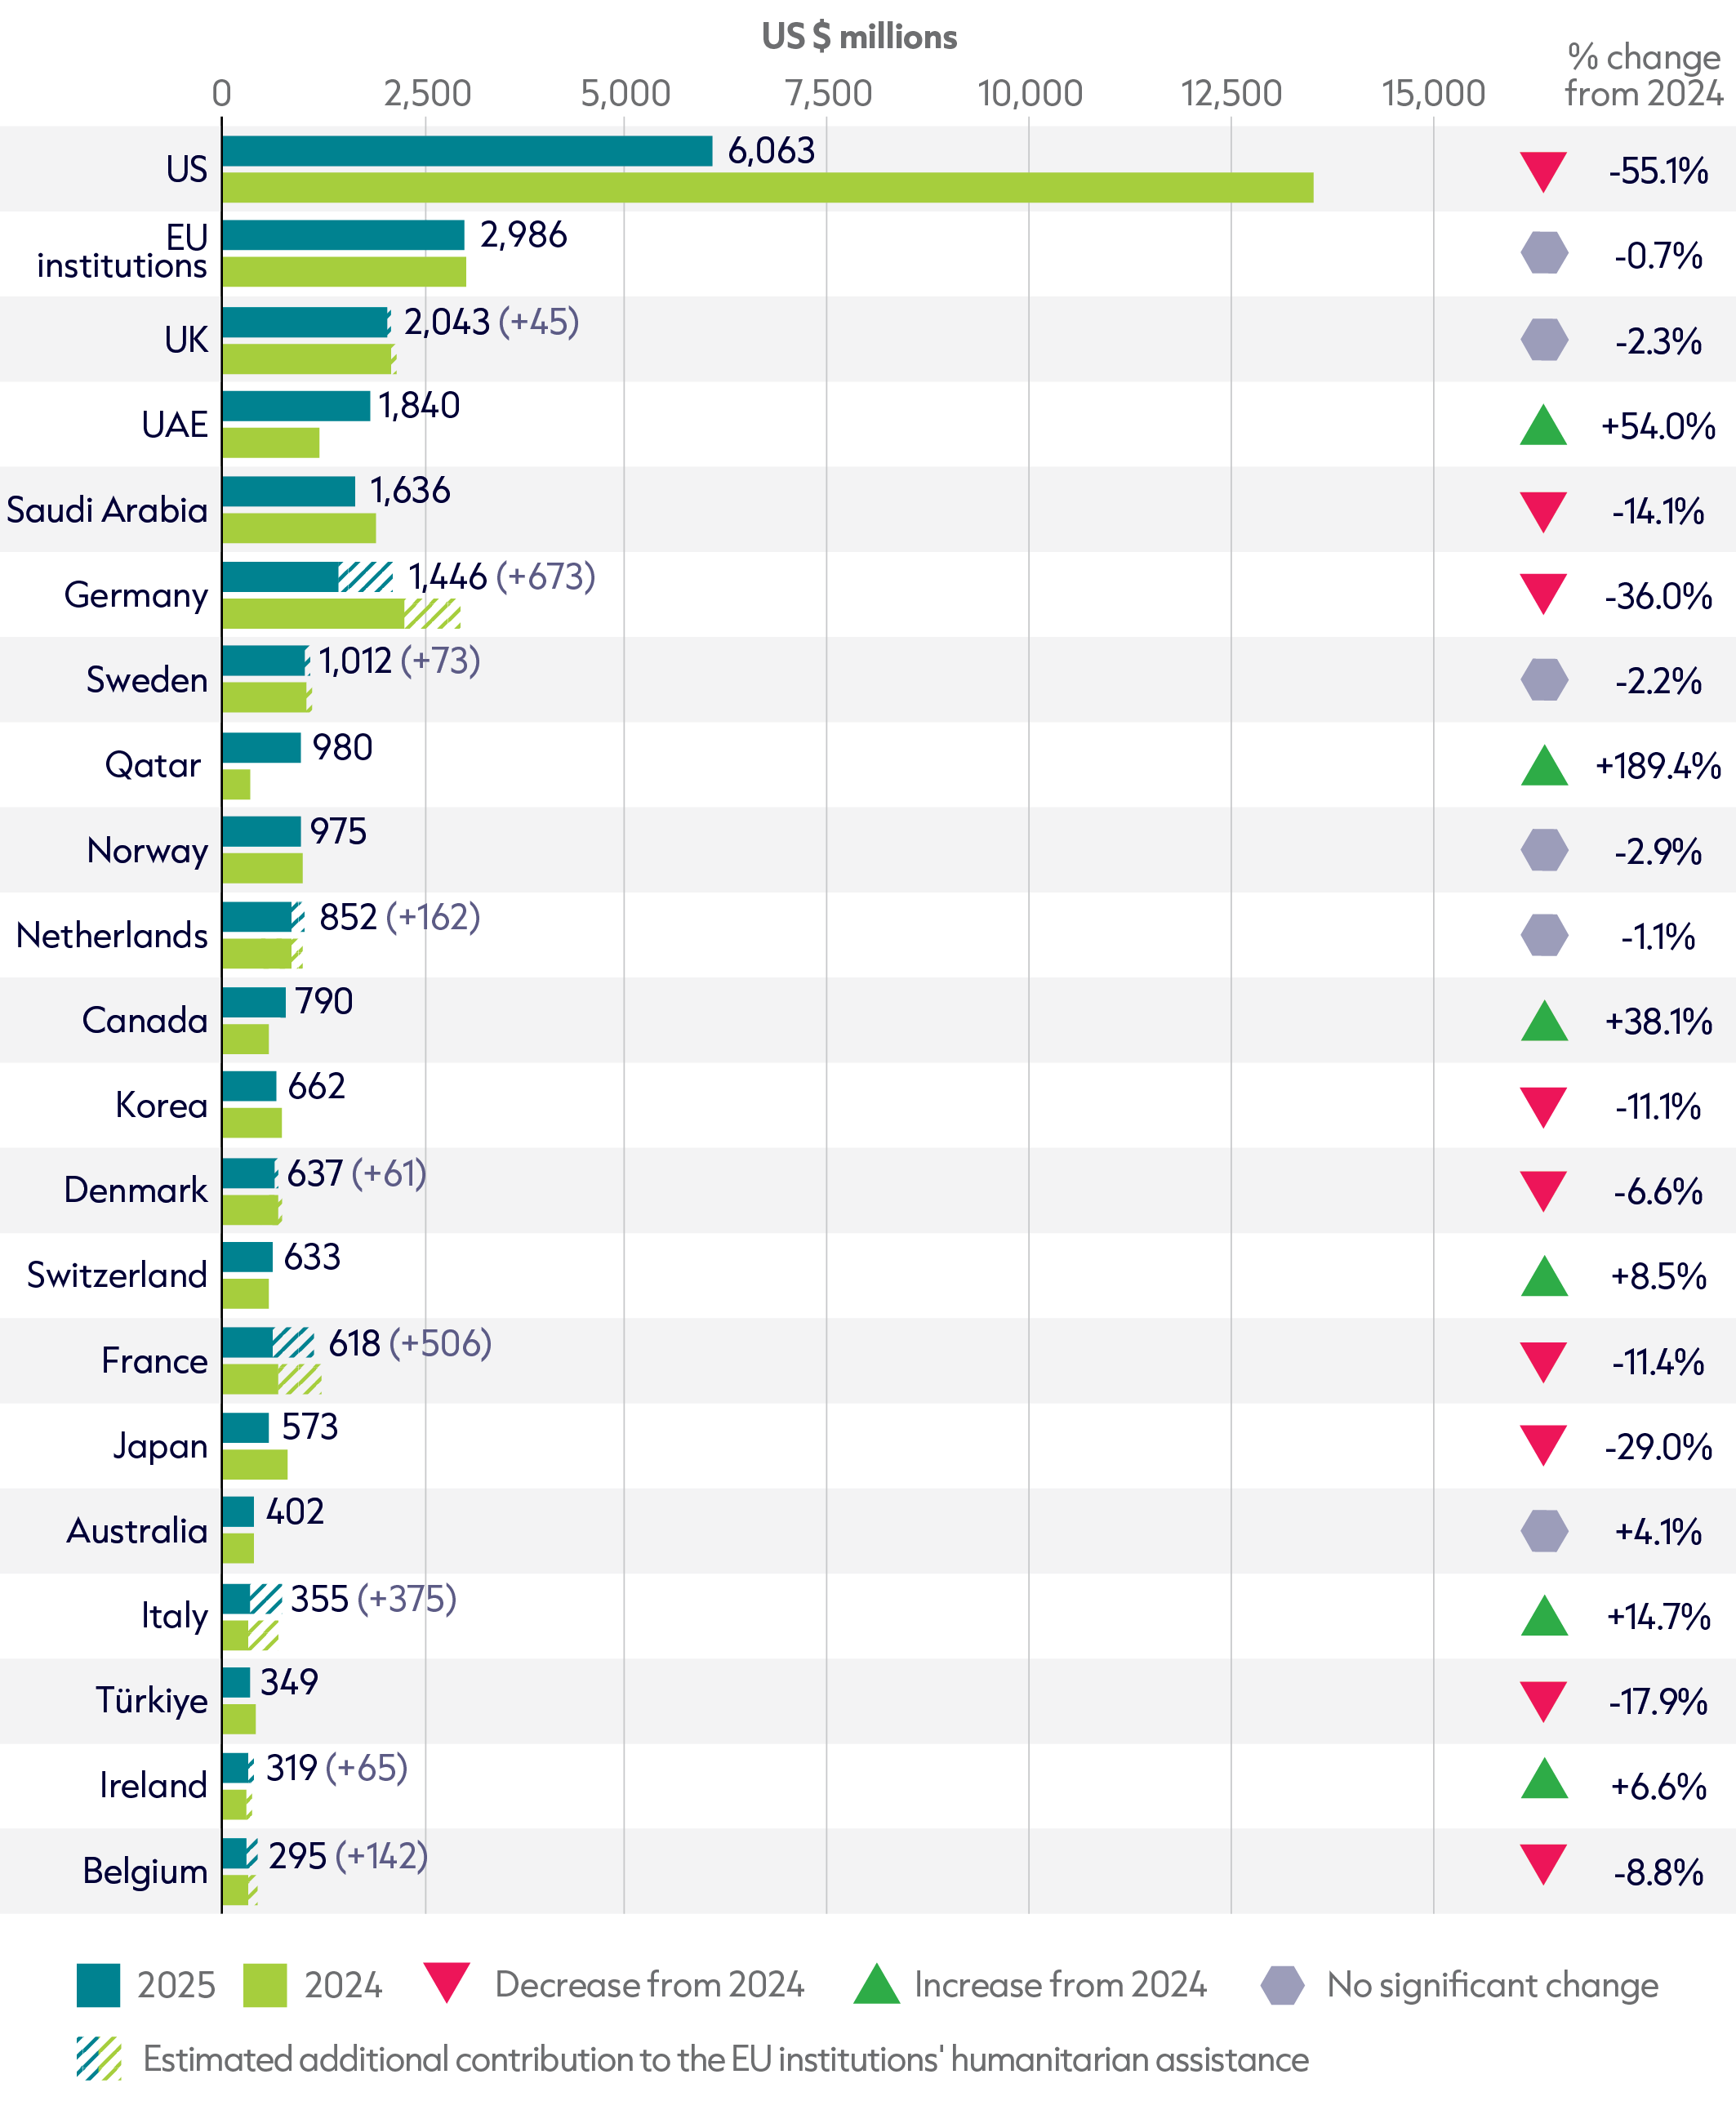
20 largest public donors and EU institutions of humanitarian assistance in 2025, and change from 2024
Source: Based on OECD DAC, UN OCHA FTS and UN CERF.
Notes: 2025 data is preliminary. Data is in constant 2024 prices. ‘Public donors’ refers to governments and EU institutions. Contributions of current and former EU member states to EU institutions’ international humanitarian assistance are shown separately to avoid double counting. Figures for 2024 differ from the GHA Report 2025 due to updated final reported international humanitarian assistance data and a different year for constant prices. UAE = United Arab Emirates.
The majority of top humanitarian donors reduced funding in 2025, with 13 of the top 20 donors cutting their humanitarian spending, including the US and Germany.
Together, these two donors accounted for 88% of total cuts in 2025.
- The largest cuts in humanitarian funding in 2025 were by the US (–US $ 7.4 billion; –55%), Germany (–US $ 814 million; –36%), Saudi Arabia (–US $ 268 million; –14%), Japan (–US $ 234 million; –29%), South Korea (–US $ 82 million; –11%), France (–US $ 80 million; –11%) and Türkiye (–US $ 76 million; –18%).
- However, a number of donors deviated from this trend and increased funding in 2025, including: the UAE (+US $ 645 million; +54%); Qatar (+US $ 642 million; +189%); Canada (+US $ 218 million, +38%) and Italy (+US $ 45 million; +15%).
- Despite the large movements in funding by many countries, a significant number of countries held stable (within 5% of last year’s disbursements), including EU institutions, the UK, Sweden, Norway, Netherlands and Australia.
Whilst the steepness of the cuts in 2025 outstripped the previous year, there does appear to be some change in collective donor behaviour. Whilst 13 of the top 20 donors reduced funding substantially in 2024 (by more than 5%), only eight of the top 20 donors did so in 2025. Similarly, only four of the top 20 donors increased funding substantially in 2024, whereas six of the top 20 donors did so in 2025. Although it appears that the humanitarian system is still experiencing declining levels of funding, this subtle shift in donor behaviour, taken together with the scenarios presented above, may be the first indication that the sector could stabilise in the near future and find a new equilibrium.
This year also marks a significant shift amongst the lead donors in the humanitarian system. Between 2013 and 2024, the top four donors had been the US, EU institutions, Germany and the UK. However, more comprehensive, as well as retrospective, reporting has allowed greater visibility for certain donors. Whilst the previous top four donors did retain these ranks between 2013 and 2020, the UAE and Saudi Arabia now occupy fourth and fifth position as lead donors in 2025, ahead of Germany in sixth, with these donors also occupying top four positions in previous years (for more on retrospective reporting, see Box 1.1).
Humanitarian funding from the US decreased by 55% in 2025. This is the largest cut of any donor in both absolute and percentage terms in 2025. However, as noted above, US funding may be stabilising in the near future at a lower equilibrium. Germany ranks second in terms of funding reductions in absolute and percentage terms. German funding in 2025 fell to US $1.4 billion, similar to levels seen a decade ago, with the nearest comparable figure being 2015 (US $1.2 billion), after peaking at US $4.5 billion in 2022. This is a 68% reduction in three years for Germany.
Germany’s decline as a humanitarian donor strangely occurs at the exact moment when it has become the top ODA donor globally despite cutting ODA in general.[4] Germany appears to be prioritising other ODA spending over humanitarian – the cut in humanitarian funding was twice as much in percentage terms than the rest of the ODA cut.
Over the past year, some donor statements suggest they will safeguard humanitarian budgets over general ODA (e.g. Switzerland[5]), aligning more closely with narratives about ODA that donor governments can justify publicly. However, the picture on whether donors are prioritising humanitarian assistance in reality is mixed:
- Analysis of preliminary 2025 Organisation for Economic Co-operation and Development (OECD) Development Assistance Committee (DAC) ODA data shows that, among donors for which data is available for both ODA and humanitarian spending, 20 favoured humanitarian spending over other forms of ODA, while 18 donors favoured the remainder of ODA. This is calculated by looking at whether the percentage change in humanitarian spend is higher than the percentage change in the rest of ODA.
- A relatively even split between favouring humanitarian and other forms of ODA is also evident when examining DAC donors only (16 favouring humanitarian funding versus 17 favouring other ODA), donors providing more than US $100 million in humanitarian assistance (11 versus 10), EU institutions and EU member states (12 versus 14) and the traditional top four donors (two versus two).
Therefore, there is inconclusive evidence that the prioritisation of humanitarian assistance is widespread amongst donors amidst the cuts in 2025. One clue as to why this may be the case comes through examining finance types. Preliminary 2025 data from the OECD DAC shows that bilateral grants experienced the largest decline amongst finance types, with a cut of 29%, followed by multilateral ODA, which saw a 27% cut. These are both finance types that humanitarian assistance is likely to sit in. This compares to bilateral ODA loans, which only saw a 10% drop, indicating a prioritisation for loans over grants.[6] Germany, for example, is looking to replace grants with more loans, according to Devex.[7]
With growing gaps between resources and needs, there are renewed calls for humanitarian budgets to be more intimately linked with set criteria, such as the EU proposal for a 0.07% of Gross National Income,[8] or a proposed fair share model that links humanitarian needs with donor’s economic strength.[9] However, the voluntary EU target is rarely met. In 2025, only eight donors met or exceeded this benchmark, including the three large Gulf donors (Qatar, 0.49%; UAE, 0.35%; Saudi Arabia, 0.13%), as well as a handful of DAC donors (Luxembourg, 0.23%; Norway, 0.19%; Sweden, 0.16%; Denmark, 0.14%; Iceland, 0.08%). A further three donors almost hit the 0.07% benchmark (Netherlands, 0.069%; Ireland, 0.069%; Switzerland, 0.068%).
1.5: Has the power balance in humanitarian funding shifted for good?
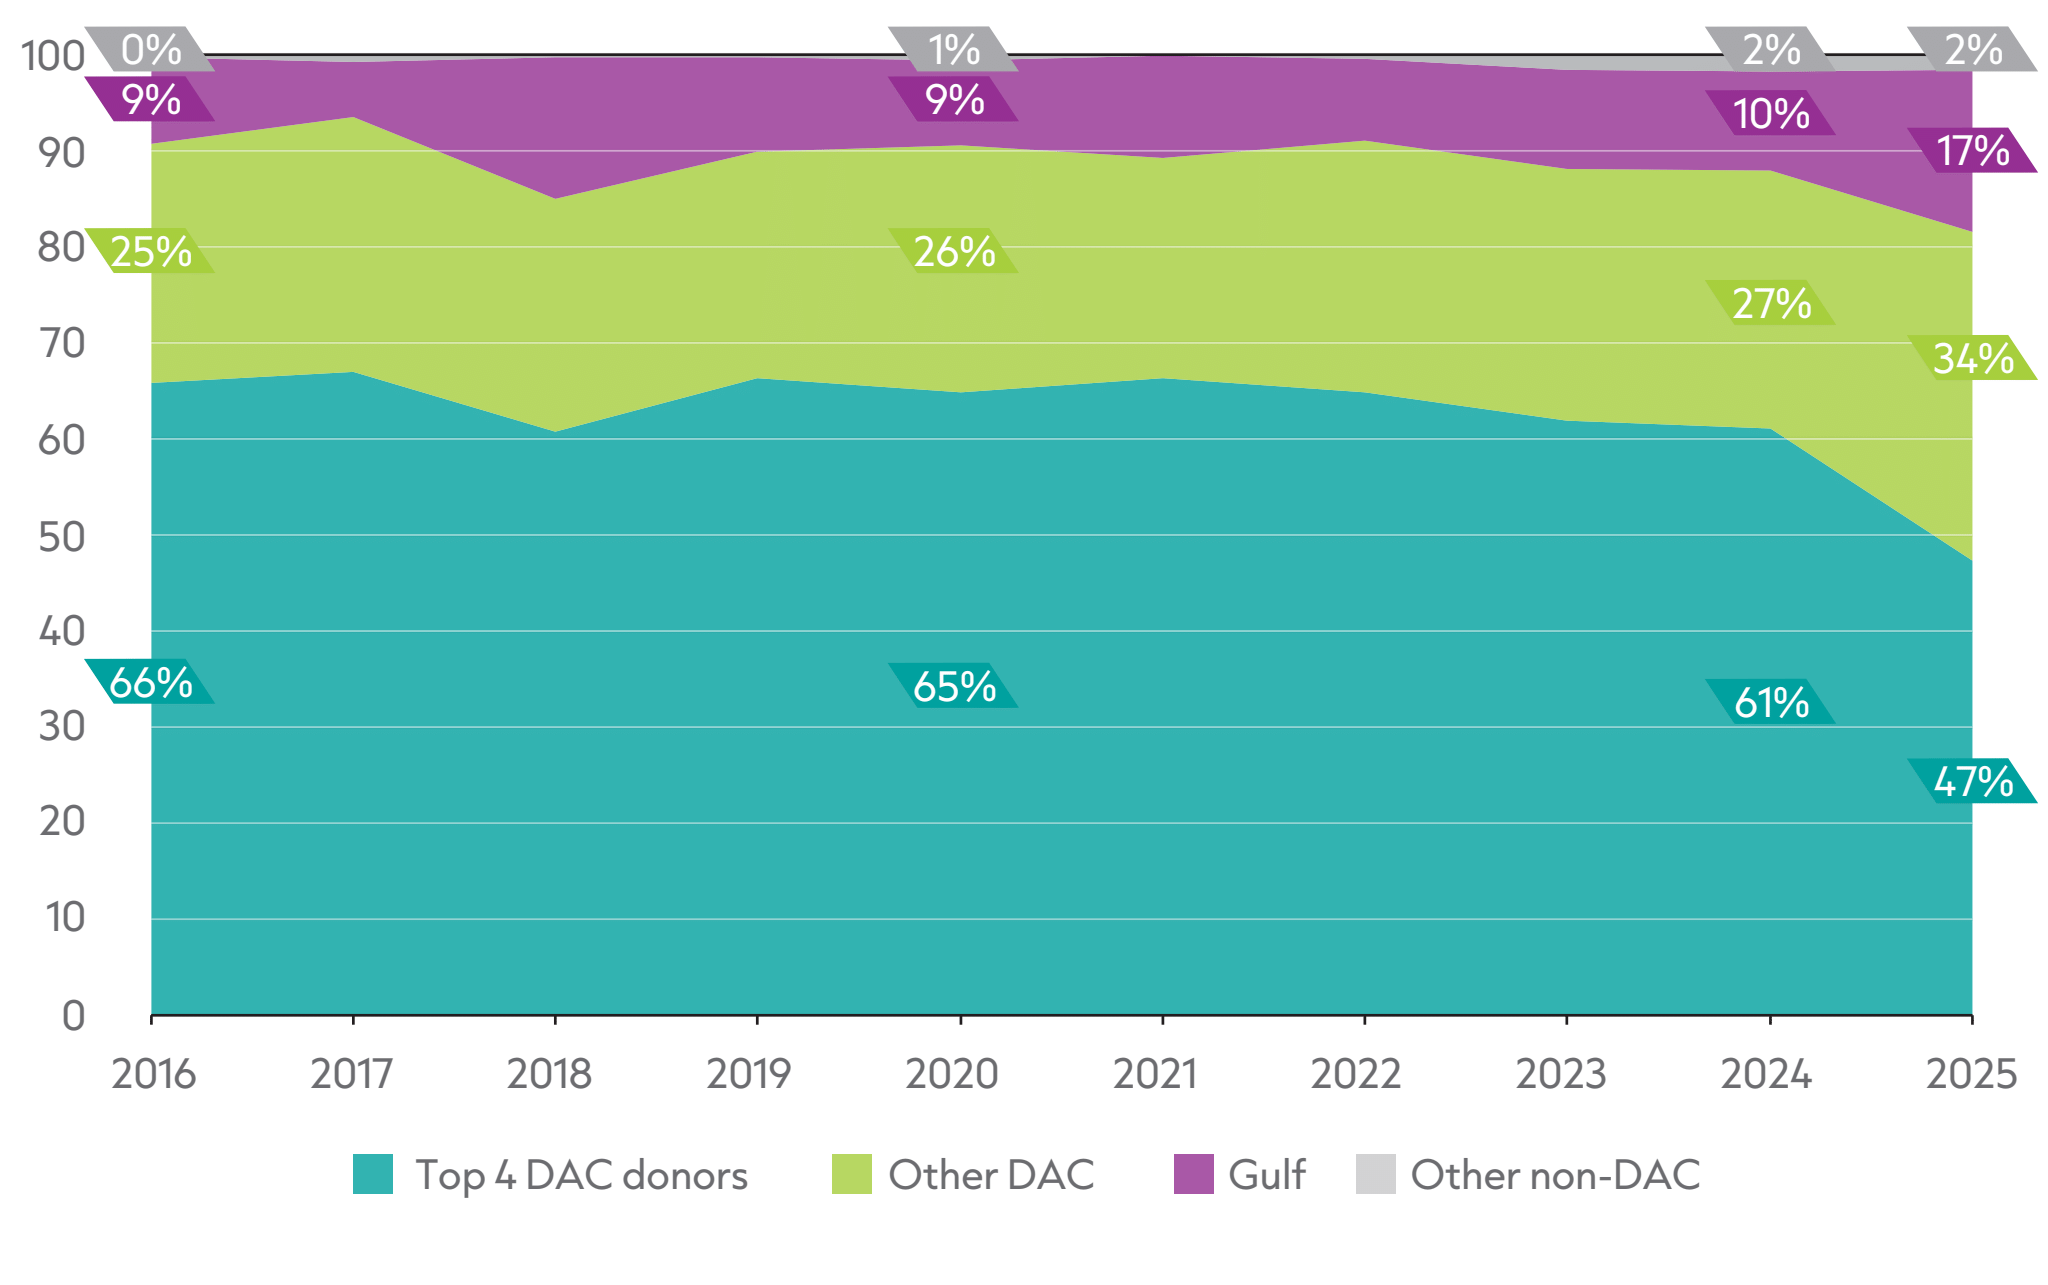
Figure 1.4: The relative donor share changed more in 2025 than in previous years, with the top four DAC donors accounting for below 50% of total funding
Share of public donor funding by donor category, 2016–2025
Source: Based on OECD DAC, UN OCHA FTS and UN CERF.
Notes: 2025 data is preliminary. Data is in constant 2024 prices. ‘Public donors’ refers to governments and EU institutions. ‘Top four DAC donors’ comprises the US, EU institutions, UK and Germany. ‘Gulf’ covers Saudi Arabia, UAE, Qatar, Kuwait, Oman and Bahrain. Historical figures differ slightly from the GHA Report 2025 due to updated final reported international humanitarian assistance data and deflation.
As a result of the funding cuts by major donors in 2025, the humanitarian funding system has become more fragmented and more multipolar.
Over the past decade, the traditional top four donors (the US, EU institutions, UK and Germany) consistently accounted for between 61% and 67% of all public donor funding, whilst other DAC members contributed between 23% and 27%. Whilst there was slightly greater variation amongst Gulf donors (6% to 15%), the humanitarian funding system was stable between these three blocs.
However, the mix of public donors funding international humanitarian assistance shifted more in 2025 than in any year in the past decade. The combined share of the traditional top four donors fell sharply from 61% in 2024 to 47% in 2025. This was by far the lowest share for these four donors over the previous decade, and down from a peak of 67% in 2017:
- This change was largely driven by funding cuts; combined funding from the top four DAC donors fell 40% from US $20.8 billion in 2024 to US $12.5 billion in 2025, against an overall contraction in public international humanitarian assistance of 22% (see Figure 1.1).
- Significant cuts from the US and Germany drove the fall in the top four donors’ share, as the US share of public international humanitarian assistance fell from 40% in 2024 to 23% in 2025, while Germany’s fell from 6.6% to 5.4%.
- The share of EU institutions and the UK both increased slightly, from 8.8% to 11% and 6.1% to 7.6%, respectively, largely reflecting flat absolute contributions against a shrinking global total, as opposed to funding increases.
As a result, the humanitarian funding system is no longer anchored to the traditional top four donors that previously formed its core funding base.
At the same time, other DAC donors (predominantly North American, European and East Asian donors), now account for their highest share in a decade. All other DAC donors combined now represent 34% of public donor funding, up from 27% in 2024. This reflects relatively stable overall funding (US $9.2 billion in 2024 and US $9.1 billion in 2025) against a falling global total.
Whilst not represented in Figure 1.4, it should be noted that EU institutions and EU member states now represent 36% of overall public humanitarian funding, up from 30% in 2024 (a three-year high). Combined with other European donors, such as Norway, Switzerland, Iceland and Liechtenstein, this ‘EU plus’ bloc represents 42% of all public donor funding (up from 35% in 2024). Whether EU or ‘EU plus’, this bloc now holds considerable power given that the US only constitutes 23% of all public donor funding in 2025.
Gulf donors also reached their highest share of public international humanitarian assistance in the last decade, accounting for 17% in 2025, up from 10% in 2024, and above the previous peak of 15% in 2018. Their combined contribution rose by almost a third, an increase of over US $1 billion (US $3.5 billion to US $4.5 billion). This stands in strong contrast to overall global reductions in funding, bringing the Gulf states’ share far closer to that of the US, when considered together.
- Within the Gulf, growth was led by Qatar, which almost tripled its international humanitarian assistance (an increase of 189% to US $980 million), and the UAE, which increased by over half (funding rose 54% to US $1.8 billion).
- These rises more than offset a 14% reduction from Saudi Arabia (down to US $1.6 billion).
- The UAE and Saudi Arabia were the fourth and fifth largest individual public donors of international humanitarian assistance in 2025 (see Figure 1.3).
Without forward-looking budgets and planning documents, it is difficult to predict whether this increase from the Gulf will be sustained, with some arguing that Gulf states may focus more on national priorities in light of costs associated with the recent war with Iran.[10]However, the increased prominence of Gulf donors within the donor mix does have implications. Gulf donors have concentrated much of their funding on a small number of contexts over the past decade (e.g. Yemen, 46%; Palestine, 16%), whereas DAC donors have given more widely with no individual crisis context receiving more than 10% of DAC funding over the past decade. Furthermore, there is evidence that Gulf donors give humanitarian funding via bilateral channels, with a recent paper noting that most of the funding from Saudi Arabia in 2024 went to local and national actors (69%), the vast majority of which went to local and national governments.[11]
Other non-DAC donors continued to account for a small share of public international humanitarian assistance at 1.6% in 2025, compared with 1.8% in 2024. Türkiye accounted for four fifths of this category in 2025.
Whilst there has been a large reduction in funding from two of the largest donors, public humanitarian assistance continues to be concentrated amongst a small number of donors, albeit less concentrated. The (new) top four donors represent 49% of all public funding (down from 61% in 2024 for the previous top four donors), the top 10 donors represent 75% (down from 81%), and the top 20 represent 95% (down from 96%).
Overall, 2025 marks a step change in the composition of public international humanitarian assistance. Following a decade where the previous four largest donors (i.e. top four DAC donors) consistently accounted for close to two thirds of funding, their combined share fell nearly 15 percentage points in a single year. With US and German budget cuts becoming the new norm, this marks a new equilibrium for the humanitarian donor mix. This is forcing a sector previously dependent on a narrow group of DAC donors to adjust, as further cuts will likely entrench donor concentration changes more in 2026, creating several implications.
Firstly, whilst the funding mix has become more diverse by default, this also creates additional pressures. In a context of reduced funding, high humanitarian need and donor power now spread more evenly, stronger donor coordination becomes more important. A more diverse donor base can also mean greater fragmentation, with a risk of different donor blocs or ecosystems not coordinating and pursuing their own priorities in parallel. This in turn may create pressure on UN agencies and international non-governmental organisations, as the main recipients of assistance, to act as ‘clearing houses’ across a wider range of diverse interests.
Secondly, changes in donor behaviour at the global level has implications for individual contexts. As Figure 2.2 shows, a significant number of contexts has seen changes in the lead donor (primarily away from the US), with a smaller yet more diverse funding mix. It is in individual contexts where donor coordination becomes even more important.
Lastly, whilst there may be a temptation to believe that US power in the humanitarian system has weakened (which it surely has given the cuts), the US continues to be the largest donor by some margin and still has agenda-setting power. An illustration of this is how US funding has influenced the UN Office for the Coordination of Humanitarian Affairs (OCHA)-managed pooled fund system.
We want to your feedback!
Share with us your insights on this year's report: The Global Humanitarian Assistance report 2026 survey
Footnotes
-
Federal Reserve Bank of St. Louis, n.d. How Bad Was the Great Depression? Gauging the Economic Impact. Available at: https://www.stlouisfed.org/the-great-depression/curriculum/economic-episodes-in-american-history-part-3; Samoiliuk M., 2026. Ukraine War Economy Tracker. Available at: https://ces.org.ua/en/tracker-economy-during-the-war/
-
UN News, 2025. UN’s humanitarian work is ‘underfunded, overstretched, and under attack’. 15 September 2025. Available at: https://news.un.org/en/story/2025/09/1165855
-
U.S. Global Leadership Coalition, 2026. International Affairs Budget Update. 1 May 2026. Available at: https://www.usglc.org/the-budget/international-affairs-budget-update-05-01-2026/
-
Chase-Lubitz J., 2026. ODA plummets by almost a quarter, driven by billions in US cuts. Devex, 9 April 2026. Available at: https://www.devex.com/news/oda-plummets-by-almost-a-quarter-driven-by-billions-in-us-cuts-112247
-
Swiss Federal Council, 2025. Development cooperation: FDFA and EAER implement Parliament’s decisions. 29 January 2025. Available at: https://www.admin.ch/en/nsb?id=103982
-
OECD, 2026. A historic decline in foreign aid: Preliminary 2025 ODA data. 9 April 2026. Available at: https://www.oecd.org/en/data/insights/data-explainers/2026/04/a-historic-decline-in-foreign-aid-preliminary-2025-oda-data.html
-
Chase-Lubitz J., 2026. Germany, the world’s top aid donor, proposes development cuts. Devex, 4 May 2026. Available at: https://www.devex.com/news/germany-the-world-s-top-aid-donor-proposes-development-cuts-112423
-
Lenarčič J., 2024. Address by Commissioner Lenarčič at the Opening Ceremony of the 2024 European Humanitarian Forum. European Commission, 18 March 2024. Available at: https://ec.europa.eu/commission/presscorner/detail/en/SPEECH_24_1553
-
Südhof R., 2025. The fading of the Humanitarian Reset: How donor governments and fair financing models could save reforms. Centre for Humanitarian Action. Available at: https://www.chaberlin.org/wp-content/uploads/dlm_uploads/2026/04/paper-reset-und-fair-share-en-web.pdf
-
Ferris N., 2026. Fallout from Iran war is ‘major new threat to foreign aid’. The Independent, 23 April 2026. Available at: https://www. independent.co.uk/news/world/middle-east/iran-war-us-aid-uae-qatar-b2962626.html
-
Pearson M. and Rieger N., 2026. The state of international humanitarian funding to local and national actors. ODI Global. Available at: https://odi.org/en/publications/the-state-of-international-humanitarian-funding-to-local-and-national-actors/